GLP-1 Receptor Agonists —
Mechanisms of Action
A comprehensive reference covering the biology of endogenous GLP-1, receptor pharmacology, intracellular signalling cascades, tissue-specific effects, and the structural basis of all licensed drug classes — including the dual GIP/GLP-1 agonism of tirzepatide.
Endogenous GLP-1
Biosynthesis, secretion, and physiological half-life
Glucagon-like peptide-1 (GLP-1) is an incretin hormone — a gut-derived peptide that augments glucose-stimulated insulin secretion. It was first isolated from intestinal extracts in the 1980s following the cloning of the proglucagon gene, and is now understood to be one of two principal incretins alongside glucose-dependent insulinotropic polypeptide (GIP).
GLP-1 is encoded within the proglucagon gene (GCG) on chromosome 2q36.3. The proglucagon precursor protein (180 amino acids) is cleaved post-translationally by prohormone convertase 1/3 (PC1/3) in intestinal L-cells, yielding:
Figure 1. Tissue-specific post-translational processing of proglucagon. PC1/3 in intestinal L-cells produces active GLP-1; PC2 in pancreatic alpha-cells yields glucagon.
GLP-1 is secreted from enteroendocrine L-cells concentrated in the distal ileum and colon, with a smaller contribution from proximal gut L-cells. Plasma GLP-1 rises within 5–15 minutes of meal ingestion — a response that is too rapid for luminal nutrients to reach the distal gut, implicating vagal and neural cephalic phase signals in early secretion, with a sustained late peak driven by direct L-cell contact with lipids and carbohydrates.
Receptor Structure & Distribution
Class B GPCR — tissue-specific expression pattern
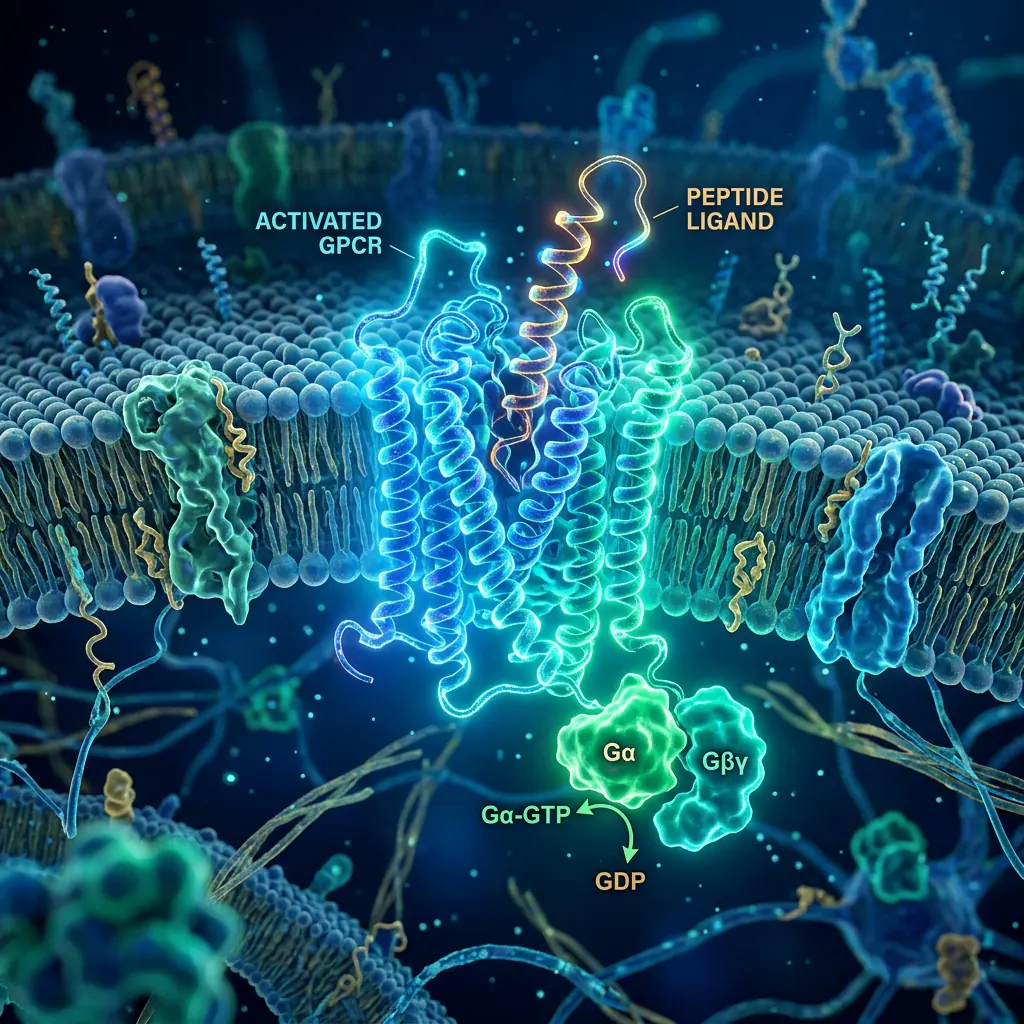
The GLP-1 receptor (GLP-1R) is a class B (secretin family) G-protein coupled receptor encoded by the GLP1R gene on chromosome 6p21. It consists of 463 amino acids with a large extracellular N-terminal domain, seven transmembrane helices, and three intracellular loops — the structural basis for Gs-protein coupling and downstream cAMP signalling.
Figure 2. GLP-1 receptor tissue distribution. The GLP-1R is expressed in pancreatic β and α cells (primary metabolic target), CNS (satiety/appetite), myocardium, kidney proximal tubule, gastrointestinal tract, and liver. NTS = nucleus tractus solitarius; HGP = hepatic glucose production.
Intracellular Signalling Cascade
cAMP–PKA axis, EPAC2, and ion channel modulation
GLP-1R activation initiates a canonical Gs-protein coupled signalling pathway, with secondary signalling through EPAC2 (exchange protein directly activated by cAMP). Together, these pathways converge on calcium-dependent insulin exocytosis and transcriptional regulation of beta-cell gene expression.
Pancreatic Effects
Beta-cell, alpha-cell, and delta-cell physiology
The pancreas is the primary pharmacological target of GLP-1 RAs. Effects span insulin secretion augmentation, glucagon suppression, and potential modification of islet cell mass — each with distinct mechanistic bases and clinical relevance.
GLP-1 RAs restore the biphasic insulin secretion pattern characteristically lost in T2DM. First-phase secretion (the acute spike within 10 minutes of glucose exposure) depends on readily-releasable granule pools; GLP-1 signalling through EPAC2 recruits these granules and lowers the Ca²⁺ trigger threshold. Second-phase secretion draws on reserve pool granules mobilised through both PKA and PI3K pathways.
GLP-1Rs are expressed on pancreatic alpha-cells, and their activation suppresses glucagon secretion in a glucose-dependent manner. Postprandial hyperglucagonaemia — a major contributor to fasting hyperglycaemia in T2DM via unopposed hepatic glucose production — is significantly attenuated. Crucially, counter-regulatory glucagon responses to hypoglycaemia are preserved because GLP-1-mediated glucagon suppression is glucose-dependent and attenuates at low plasma glucose.
GLP-1R expression has also been identified on pancreatic delta-cells (which secrete somatostatin) and on the vagal afferents innervating the islets. The contribution of local paracrine somatostatin release to GLP-1-mediated glucagon suppression remains mechanistically debated, with evidence supporting both direct alpha-cell GLP-1R signalling and indirect somatostatin-mediated suppression as concurrent pathways.
Extrapancreatic Effects
CNS, cardiovascular, renal, hepatic, and gastrointestinal
| Tissue | Receptor Expression | Primary Effect | Clinical Relevance |
|---|---|---|---|
| Hypothalamus | Arcuate nucleus, PVN, lateral hypothalamic area | Appetite suppression ↓ Food intake | Weight loss 5–20% |
| Brainstem (NTS) | Nucleus tractus solitarius | Satiety signalling; nausea at supraphysiological doses Dose-dependent | GI side effects |
| Stomach | Myenteric plexus; smooth muscle | Gastric emptying delay ↓ Motility | Flattened PPG; anaesthetic risk |
| Myocardium | GLP-1R on cardiomyocytes, endothelium | Mild chronotropy ↑ HR +2–4 bpm; anti-inflammatory; ischaemic preconditioning | SELECT: −20% MACE |
| Vasculature | Endothelial cells; VSMCs | Endothelial NO↑; anti-atherogenic; mild BP reduction ↓ 2–4 mmHg SBP | CV risk reduction |
| Kidney (PCT) | Proximal convoluted tubule | Natriuresis ↓ Na reabsorption; reduced SGLT2 expression; anti-inflammatory | FLOW: −24% eGFR decline |
| Liver | Hepatocytes (low-level expression) | Hepatic glucose production ↓; reduced hepatic lipogenesis; MASLD improvement | Steatohepatitis benefit |
| Adipose tissue | Adipocytes (indirect via CNS) | Lipolysis modulation; visceral fat preferential reduction ↓ Fat mass | Metabolic risk reduction |
Glucose-Dependent Insulinotropism
The mechanistic basis of hypoglycaemia safety
The defining safety advantage of GLP-1 RAs — near-absent hypoglycaemia risk in monotherapy — is a direct consequence of the glucose-dependent nature of GLP-1R-mediated insulin secretion. This is not a pharmacokinetic property but a fundamental signalling constraint.
GLP-1 RAs amplify glucose-stimulated insulin secretion — they do not drive insulin secretion in the absence of glucose. At plasma glucose below ~4–4.5 mmol/L, the insulinotropic effect is physiologically silent.
The critical insight lies in the cooperative gating of KATP channels. For GLP-1-mediated PKA phosphorylation of KATP channels to translate into membrane depolarisation, the channels must already be partially closed by ATP generated from glucose oxidation. At low plasma glucose:
Figure 3. The glucose-dependent gating mechanism explaining why GLP-1 RAs do not cause hypoglycaemia in monotherapy. PKA-mediated KATP channel phosphorylation requires existing partial channel closure by glucose-derived ATP to produce membrane depolarisation.
Drug-Specific Pharmacology
Structural basis of receptor activity and extended half-life
All licensed GLP-1 RAs share the core pharmacological mechanism of GLP-1R agonism but differ fundamentally in their structural basis for DPP-4 resistance, albumin-binding strategy, elimination half-life, and receptor activation kinetics. These differences translate into clinically relevant distinctions in dosing frequency, weight loss potency, and adverse effect profile.
Tirzepatide — Dual Agonism
GIP receptor pharmacology and synergistic weight loss
The GIP receptor (GIPR) is a class B GPCR structurally related to GLP-1R, and like GLP-1, GIP is an incretin hormone released from intestinal K-cells in the proximal duodenum. Despite comparable insulinotropic potency in healthy individuals, the incretin effect of GIP is paradoxically preserved in T2DM — unlike GLP-1 — but GIP-mediated insulin secretion may be blunted by GIP receptor downregulation in the setting of chronic hyperglycaemia.
References: Drucker DJ. Mechanisms of Action and Therapeutic Application of Glucagon-like Peptide-1. Cell Metabolism 2018. · Nauck MA et al. NEJM 2021. · Jastreboff AM et al. NEJM 2022 (SURMOUNT-1). · Lincoff AM et al. NEJM 2023 (SELECT). · Marso SP et al. NEJM 2016 (LEADER). · Holman RR et al. NEJM 2017 (SUSTAIN-6). · NICE NG28 February 2026. · SfE GLP-1 RA guidelines 2024. Data pertain to licensed adult doses in UK-approved indications unless stated.
Visual reference for mechanisms of action
Each illustration below is paired with a clinical summary and detailed explanation. Click any image to expand. Figures are numbered in teaching order and grouped by theme.
Overview
GLP-1-centric metabolic universe
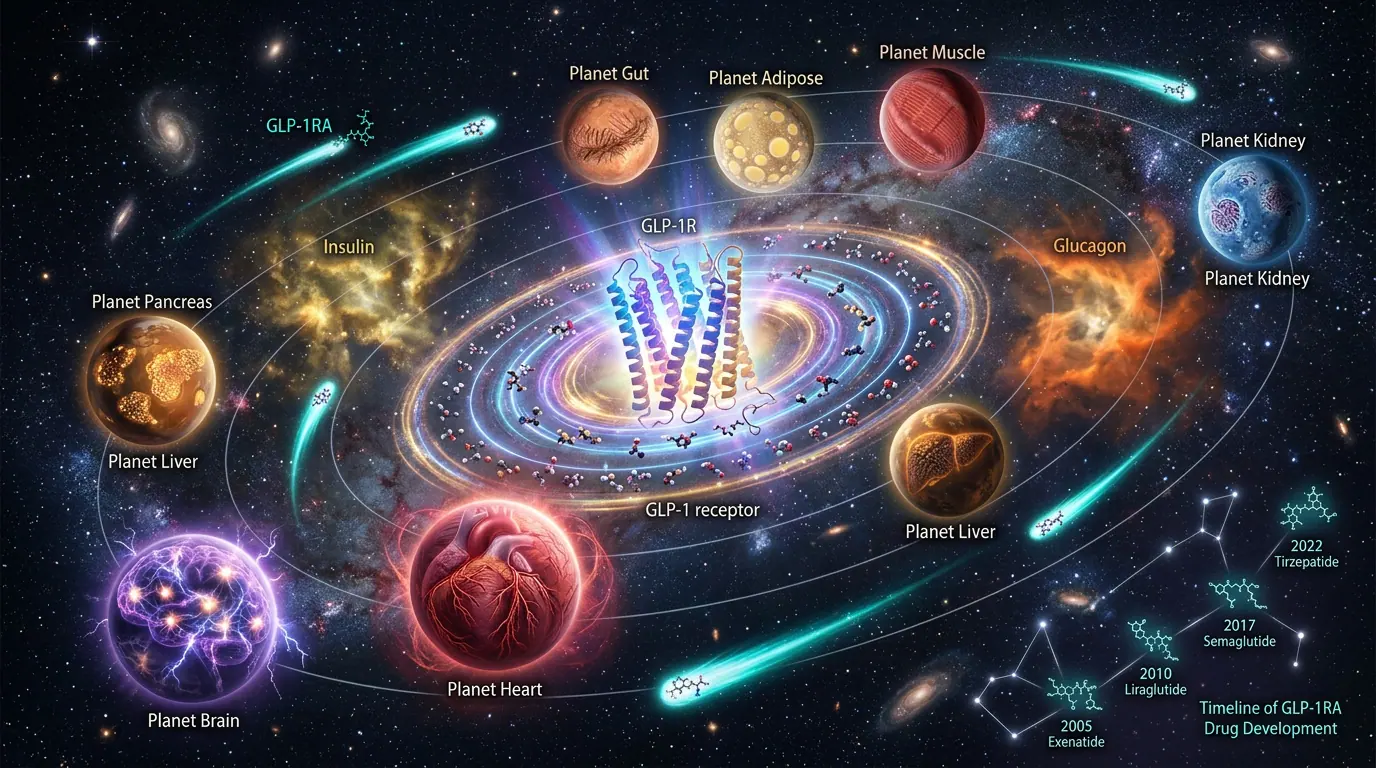
Image description
The illustration presents Conceptual map of GLP-1 physiology and therapeutics.
Clinical interpretation
Illustrates the centrality of GLP-1 signalling in modern metabolic medicine — from diabetes and obesity to cardiovascular and renal risk reduction.
Therapeutic GLP-1 landscape
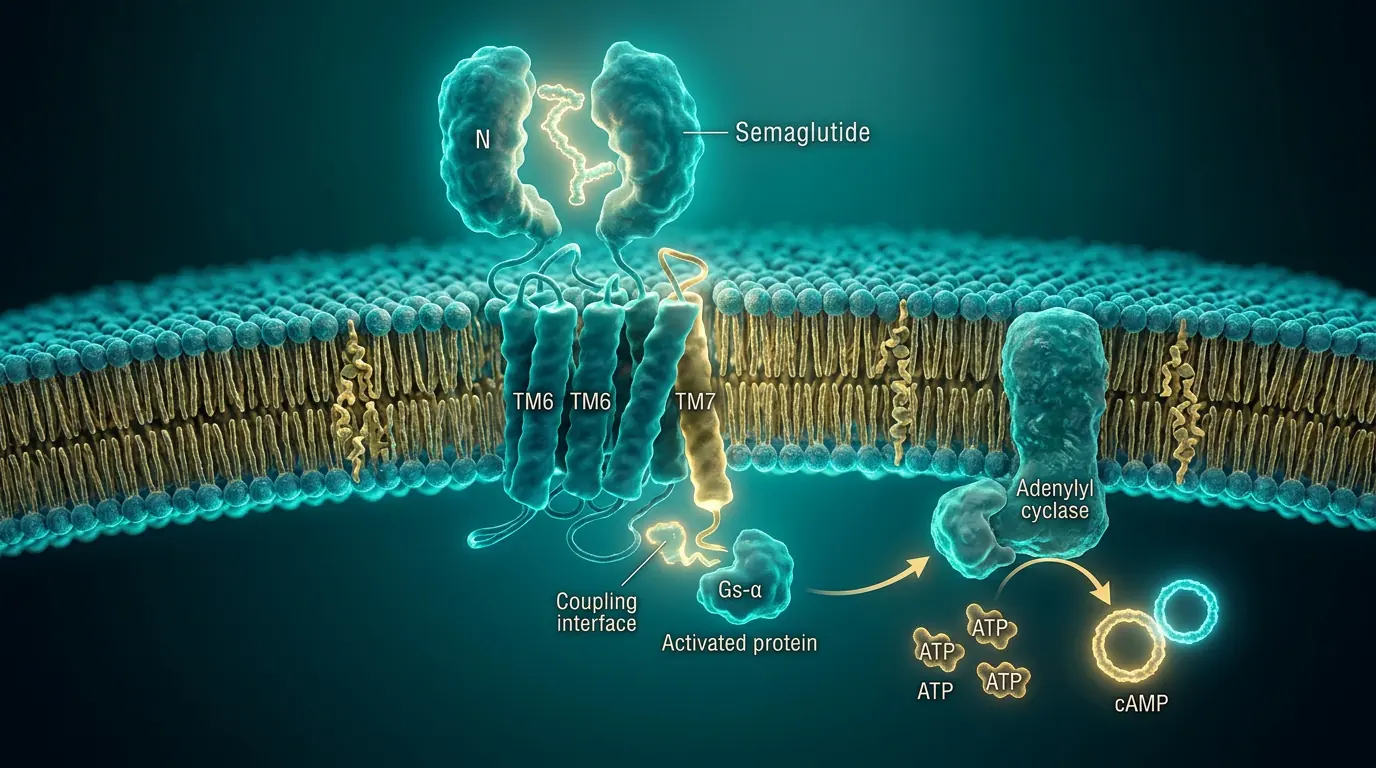
Image description
The illustration presents Visual summary of drug classes and organ targets.
Clinical interpretation
Useful orientation for clinicians navigating multiple agents (short-acting exenatide, daily liraglutide, weekly semaglutide/dulaglutide/tirzepatide, oral semaglutide, investigational orforglipron).
Endogenous GLP-1 & L-cell biology
The GLP-1 factory — L-cell sensing and secretion
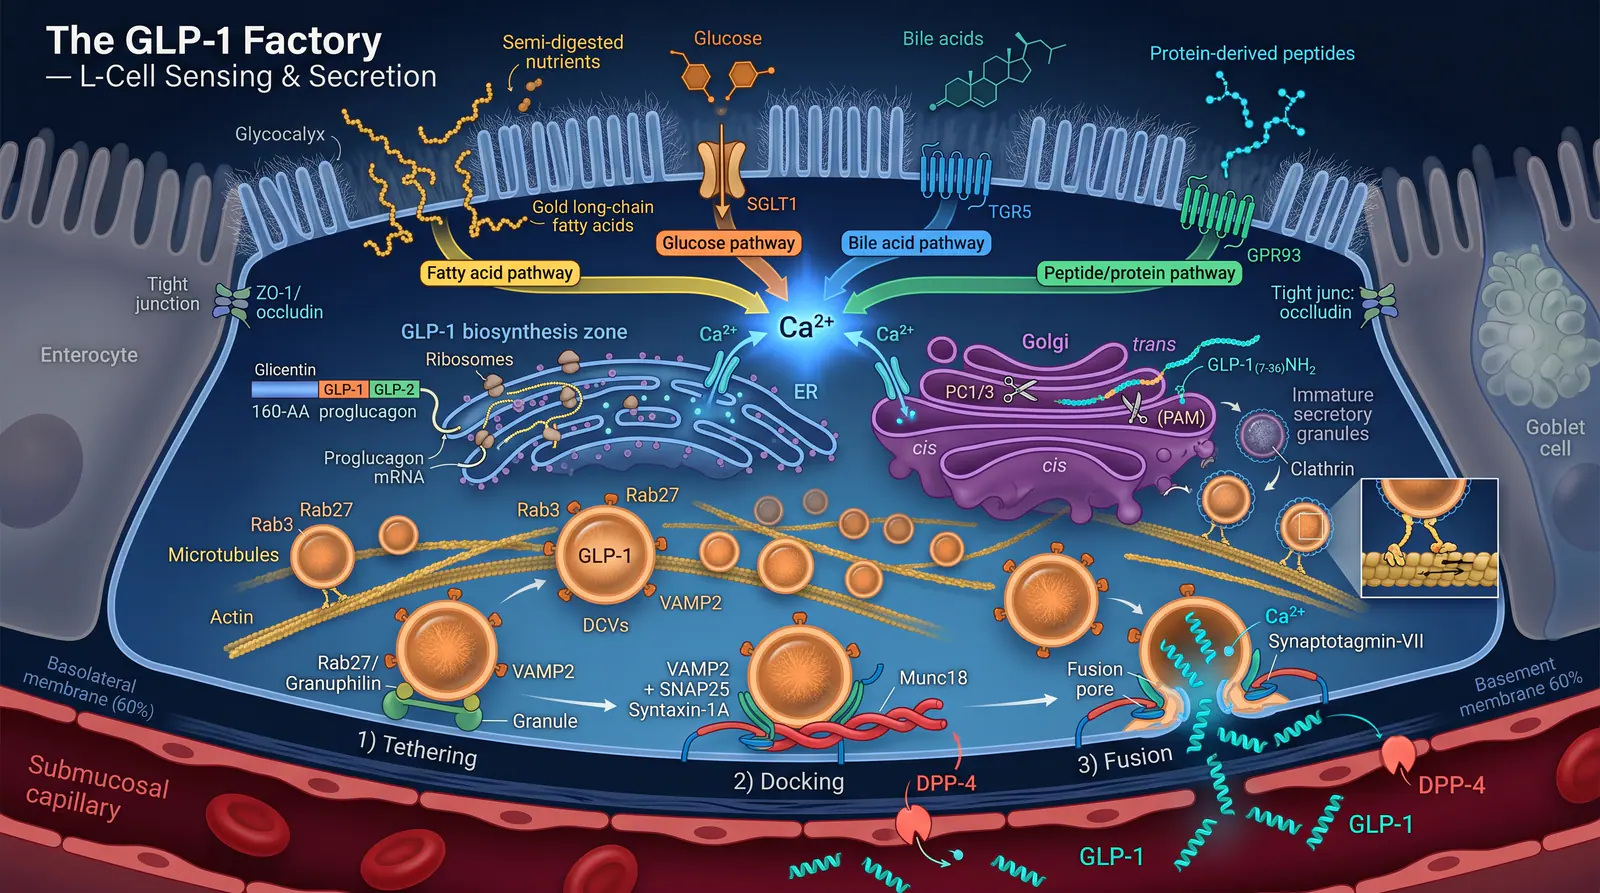
Image description
The illustration presents Nutrient sensing at the intestinal L-cell drives proglucagon processing and vesicular GLP-1 release.
Clinical interpretation
Intestinal L-cells in the distal ileum and colon sense luminal glucose (via SGLT1), lipids (GPR120/FFAR1), and bile acids (TGR5), triggering Ca²⁺ influx and cAMP elevation. Proglucagon is cleaved by PC1/3 to GLP-1(7–36)amide, packaged into dense-core vesicles, and released via SNARE machinery (VAMP2, SNAP25, Rab27). Active GLP-1 reaches the portal circulation but is degraded within 1–2 minutes by DPP-4 to the inactive metabolite GLP-1(9–36), explaining why native peptide cannot be used therapeutically without structural modification.
Proglucagon processing in the L-cell
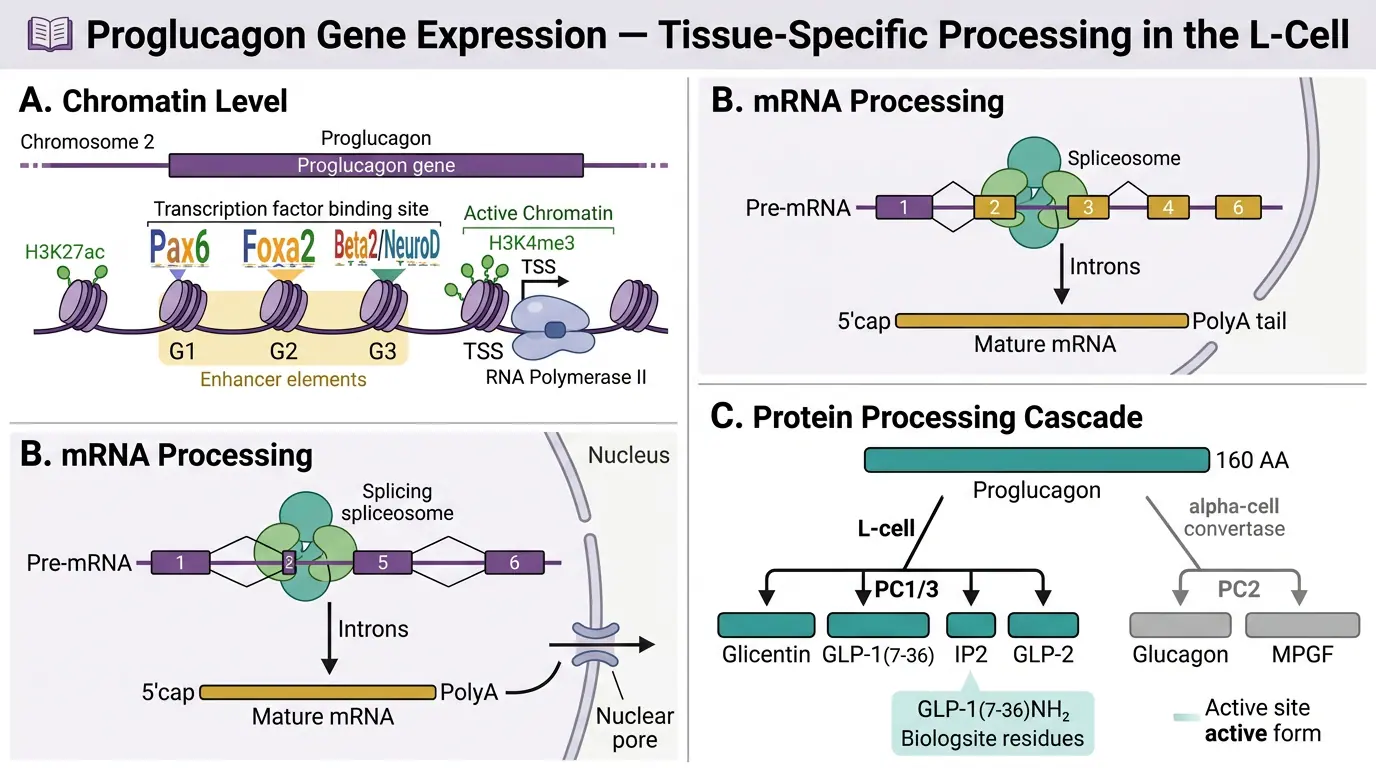
Image description
The illustration presents Tissue-specific prohormone convertase expression determines peptide products.
Clinical interpretation
The GCG gene encodes proglucagon. In intestinal L-cells, PC1/3 cleaves proglucagon to GLP-1, GLP-2, and glicentin-related peptides; in pancreatic α-cells, PC2 favours glucagon production. This tissue specificity explains why circulating GLP-1 originates predominantly from gut enteroendocrine cells rather than the pancreas.
Integrated GLP-1 biology overview
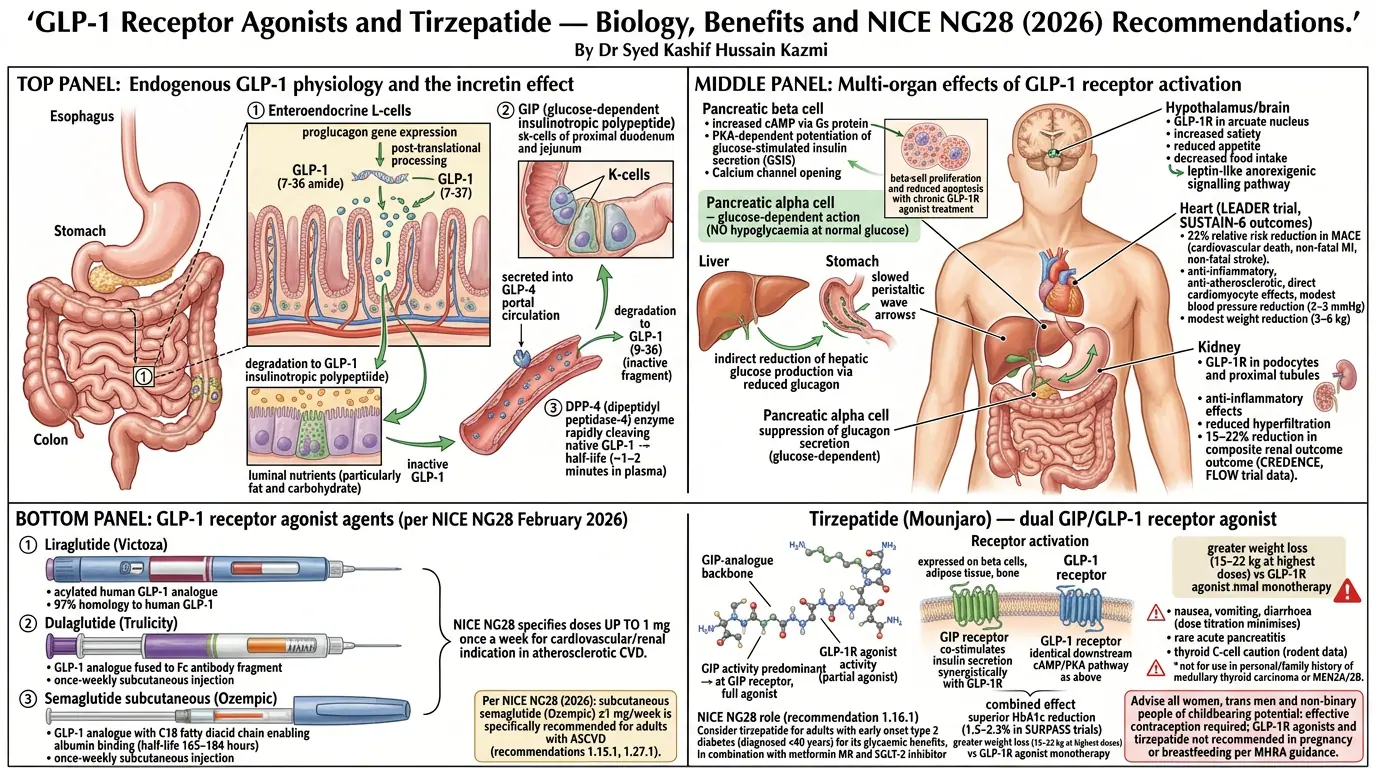
Image description
The illustration presents From gene expression to receptor-mediated effects across metabolic tissues.
Clinical interpretation
GLP-1 biology spans biosynthesis in L-cells, rapid inactivation by DPP-4, renal clearance, and receptor-mediated actions on insulin secretion, glucagon suppression, gastric emptying, appetite, and cardiovascular function. Therapeutic agents modify each step: analogues resist DPP-4; albumin binding prolongs half-life; oral formulations (semaglutide + SNAC) bypass first-pass degradation.
DPP-4 degradation of active GLP-1
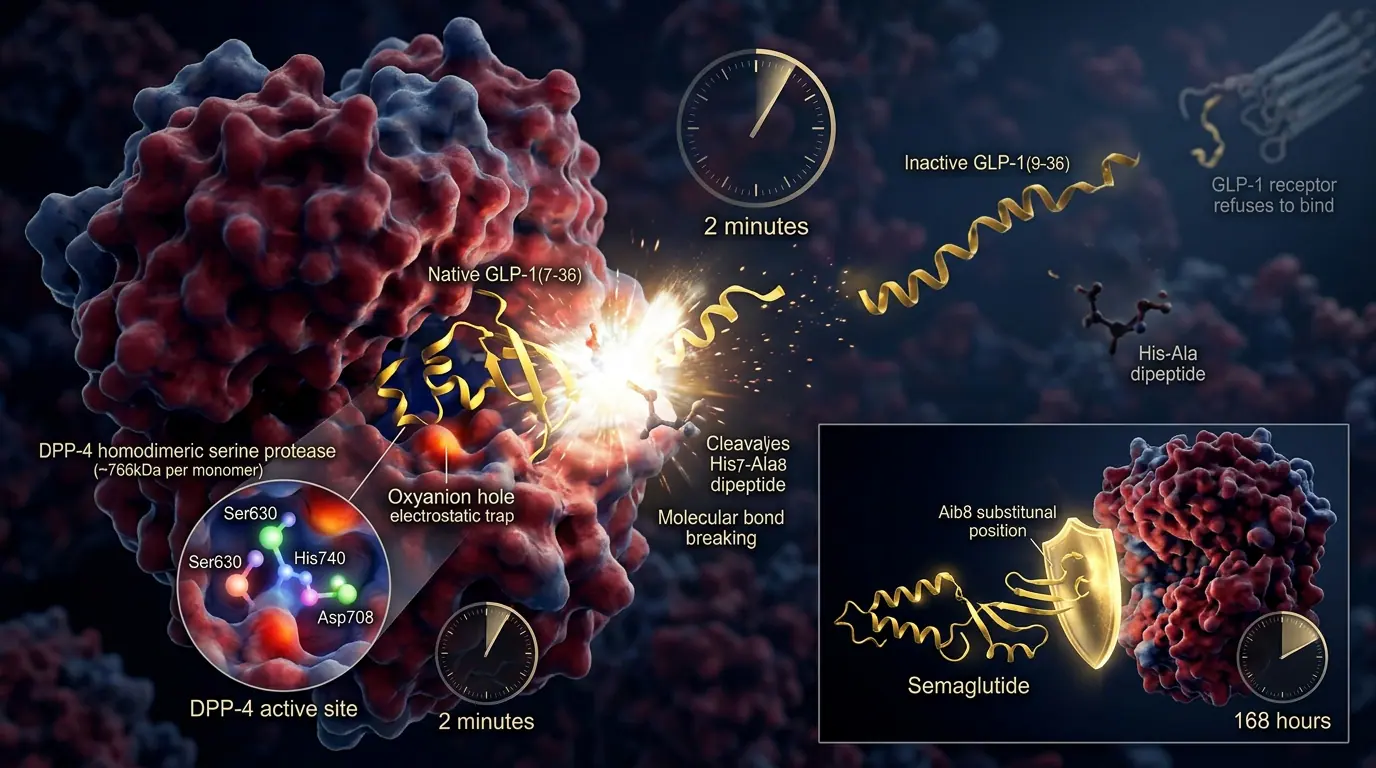
Image description
The illustration presents Dipeptidyl peptidase-4 cleaves the N-terminal dipeptide, terminating biological activity.
Clinical interpretation
DPP-4 is a ubiquitous serine protease (also on endothelial cells) that removes the N-terminal His-Ala from GLP-1(7–36), forming GLP-1(9–36) which acts as a weak GLP-1R antagonist at high concentrations. This limits the half-life of native GLP-1 to approximately 1–2 minutes. GLP-1 RAs incorporate structural modifications (e.g. amino acid substitutions, fatty acylation) to resist DPP-4 while maintaining receptor potency.
Receptor structure & distribution
GLP-1 receptor structure (Class B GPCR)
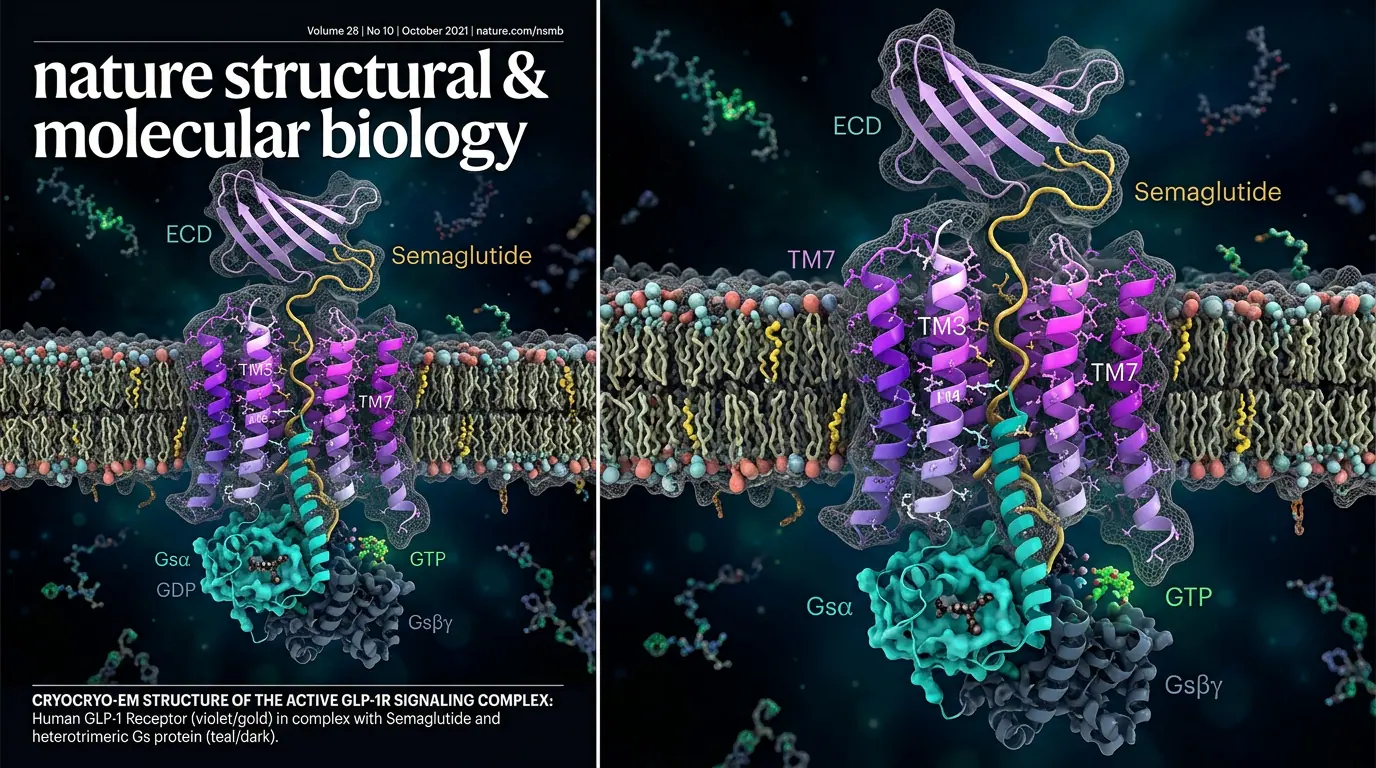
Image description
The illustration presents Large N-terminal extracellular domain binds peptide; seven TM helices couple to Gαs.
Clinical interpretation
The GLP-1R exhibits the class B GPCR architecture: an extracellular domain for peptide recognition, a transmembrane core, and intracellular loops for G-protein coupling. Cryo-EM structures with bound GLP-1 and Gs explain basis for biased agonism and small-molecule allosteric modulators in development. Receptor expression is highest in pancreatic islets, CNS, heart, kidney, and GI tract.
GLP-1R activation on the β-cell
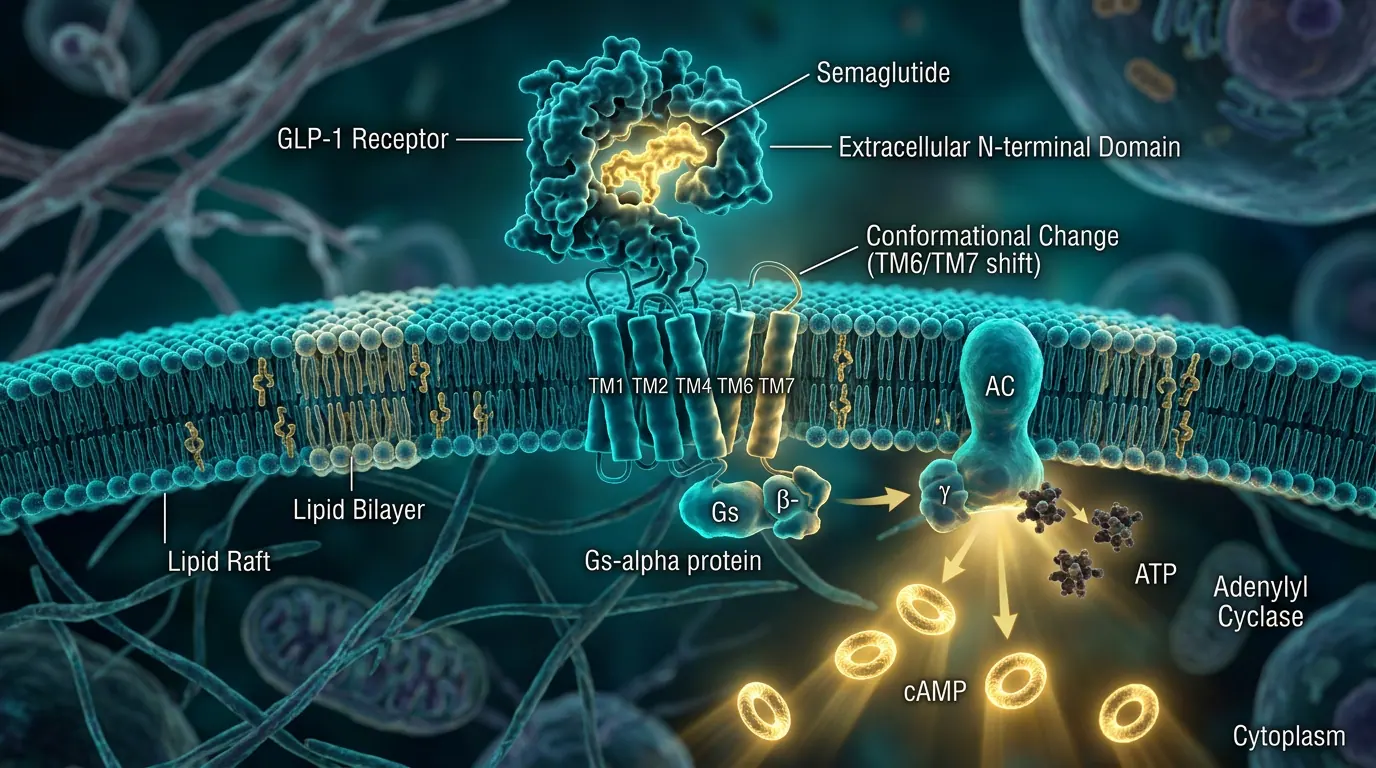
Image description
The illustration presents Ligand binding stabilises active conformation and Gαs coupling.
Clinical interpretation
GLP-1 binding promotes receptor coupling to Gαs, increasing adenylyl cyclase activity and cAMP. Sustained signalling with GLP-1 RAs can upregulate insulin gene transcription (via CREB and PDX-1) and promote β-cell proliferation in preclinical models, though clinical β-cell mass changes are modest in humans.
Intracellular signalling
cAMP nanodomains in the GLP-1R-stimulated β-cell
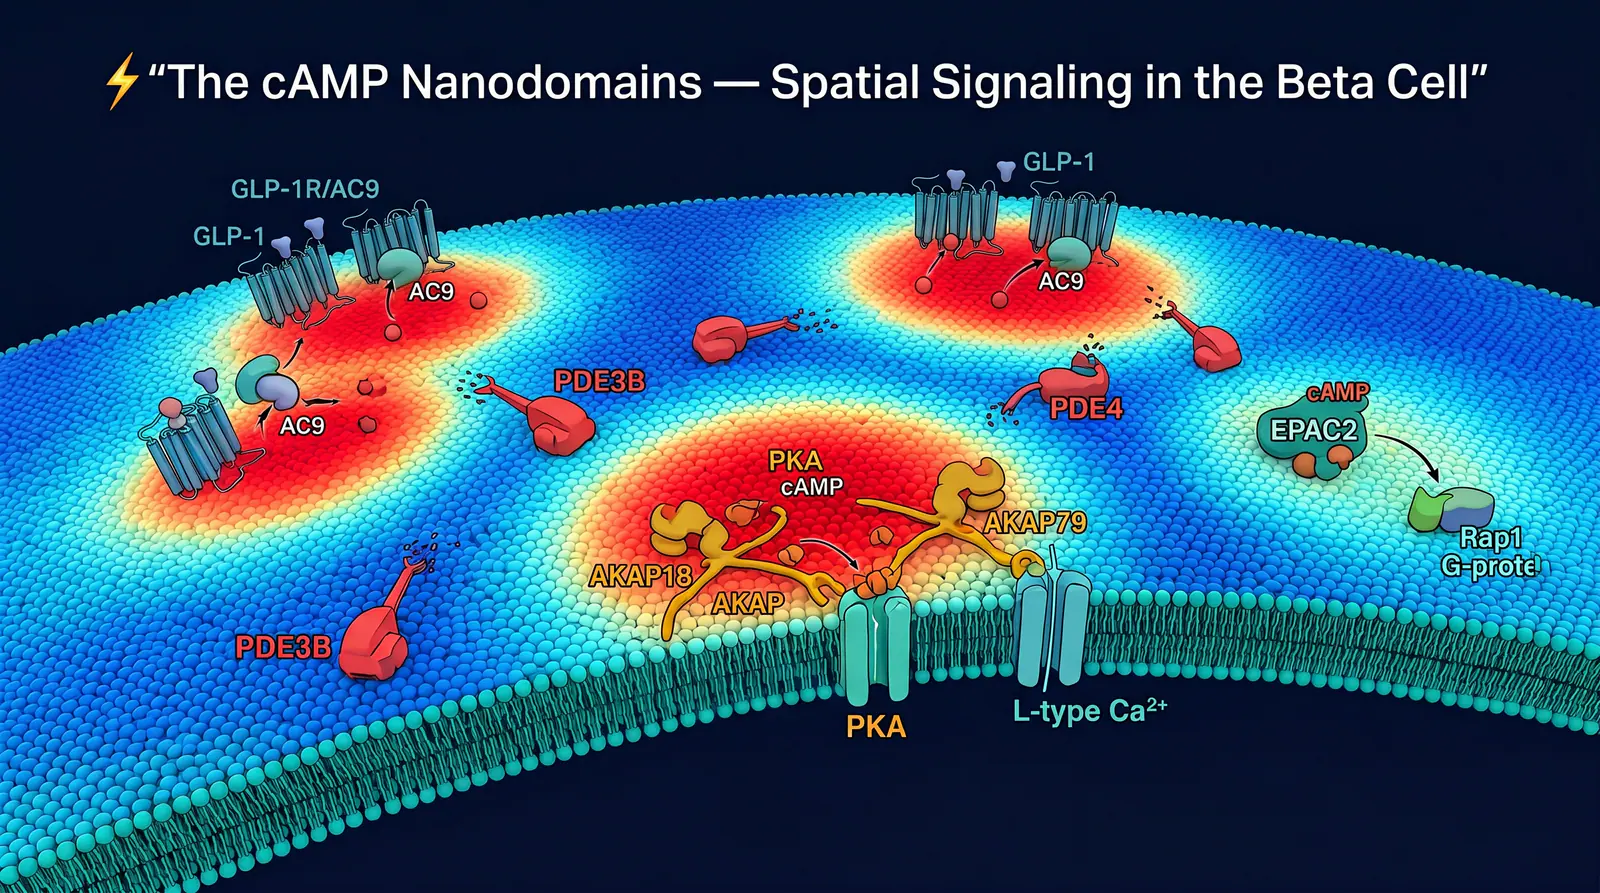
Image description
The illustration presents Spatially restricted cAMP signalling coordinates PKA and EPAC2 pathways for insulin exocytosis.
Clinical interpretation
GLP-1 receptor couples primarily to Gαs, activating adenylyl cyclase (especially AC5/AC6) to generate cAMP. Rather than a uniform second-messenger pool, cAMP forms microdomains near the plasma membrane and insulin granules. PKA anchored by AKAPs phosphorylates KATP channels, VDCCs, and exocytosis proteins; EPAC2 activates Rap1 to prime granules. Phosphodiesterases PDE3B and PDE4 limit cAMP spread, ensuring signalling remains glucose-dependent and preventing inappropriate insulin release at low glucose.
Signalling bifurcation — PKA vs EPAC2
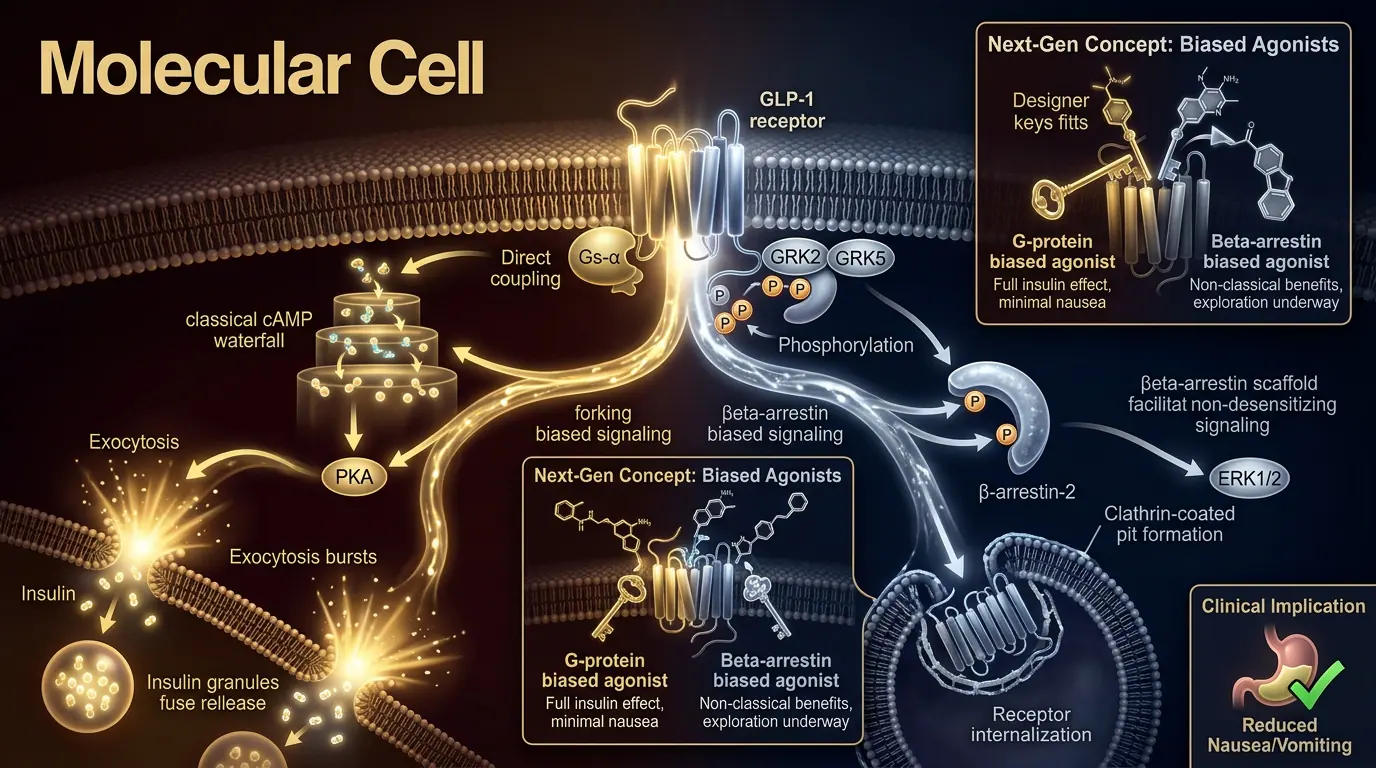
Image description
The illustration presents Parallel cAMP effector pathways control distinct steps in insulin secretion.
Clinical interpretation
PKA phosphorylates β-cell ion channels and transcription factors; EPAC2 activates Rap1 to increase granule docking. GLP-1 RAs engage both arms; the relative contribution varies by glucose concentration and chronicity of exposure.
Cellular signalling network I
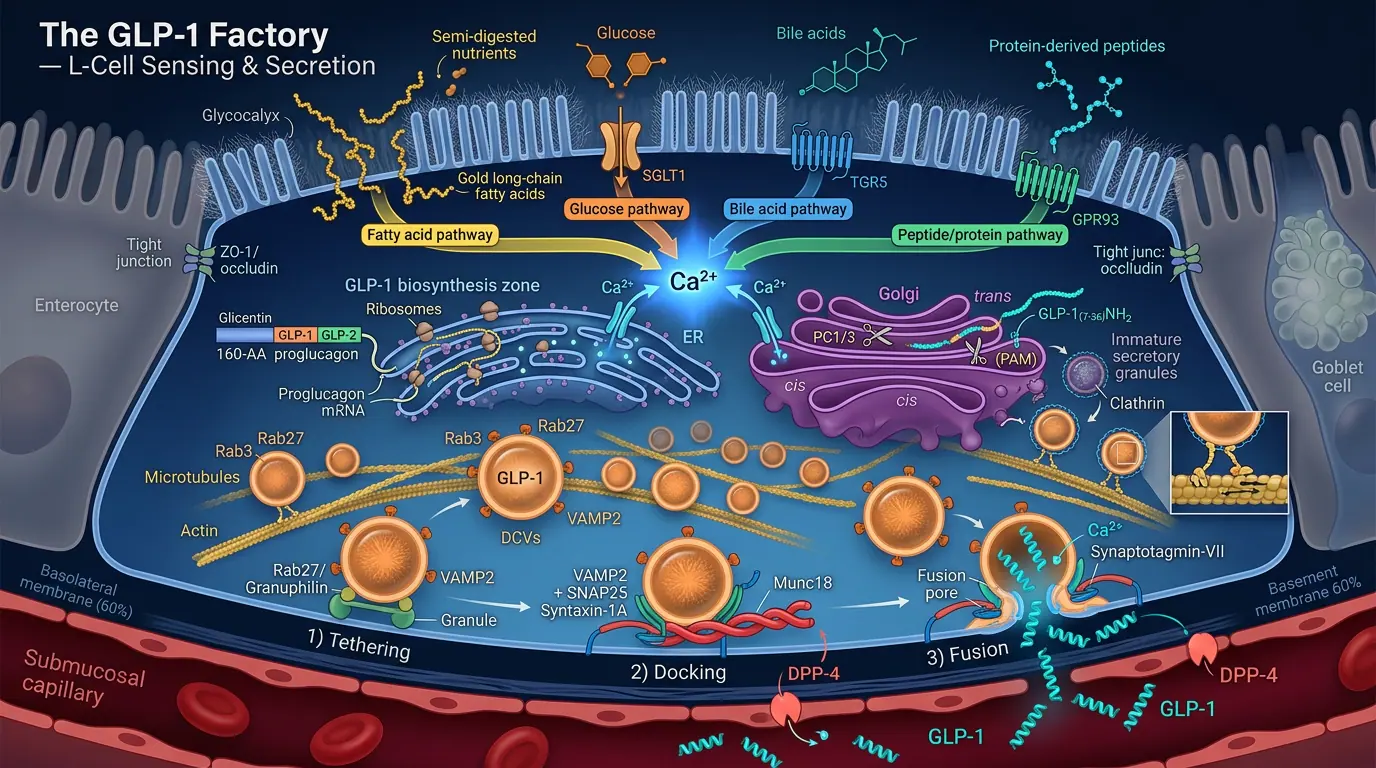
Image description
The illustration presents Second-messenger integration downstream of GLP-1R.
Clinical interpretation
Beyond cAMP, GLP-1R may engage β-arrestin pathways influencing receptor trafficking and potentially biased signalling. Chronic GLP-1R activation modulates gene expression programmes supporting β-cell phenotype maintenance.
Cellular signalling network II
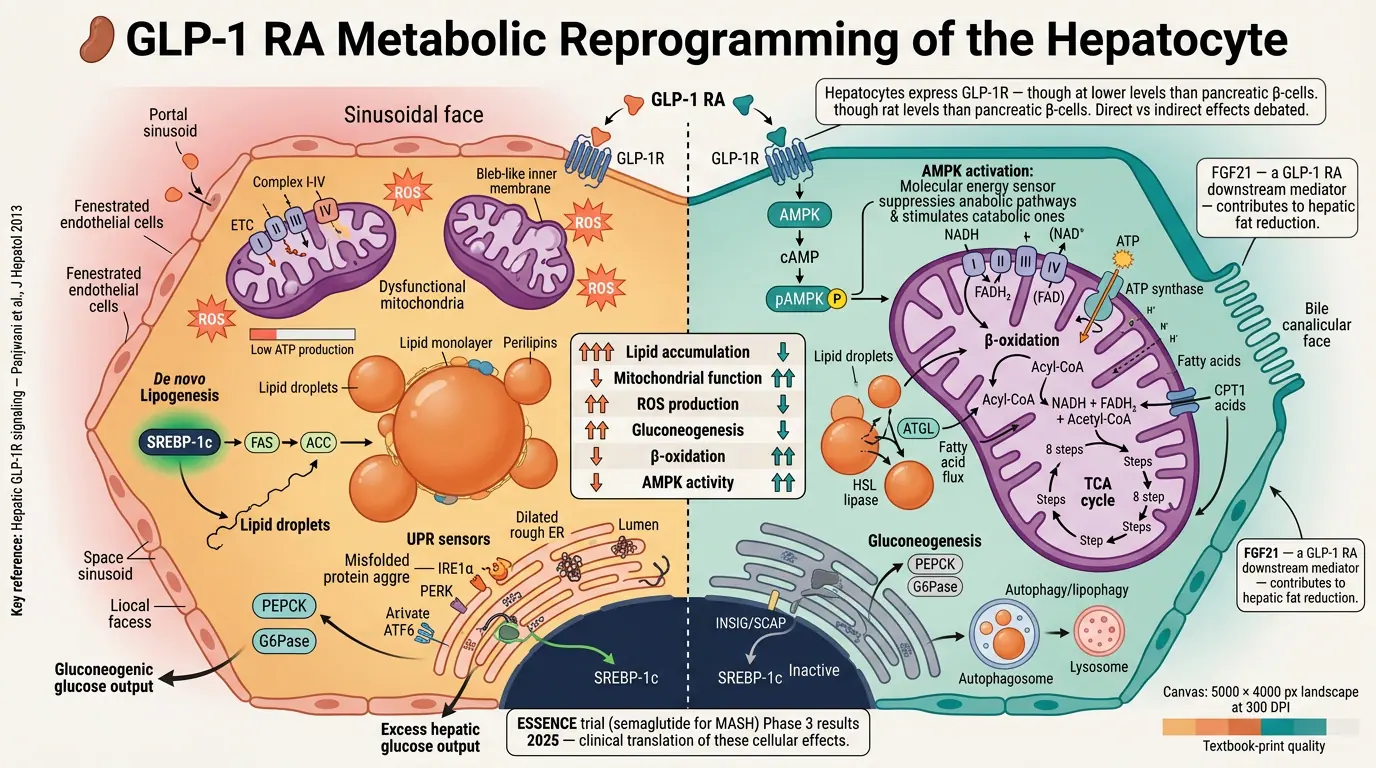
Image description
The illustration presents Cross-talk with insulin and growth factor pathways.
Clinical interpretation
GLP-1R signalling intersects PI3K–AKT and MAPK pathways indirectly, affecting survival signalling in experimental β-cell stress models — relevance to disease modification hypotheses in T2DM.
Cellular signalling network III
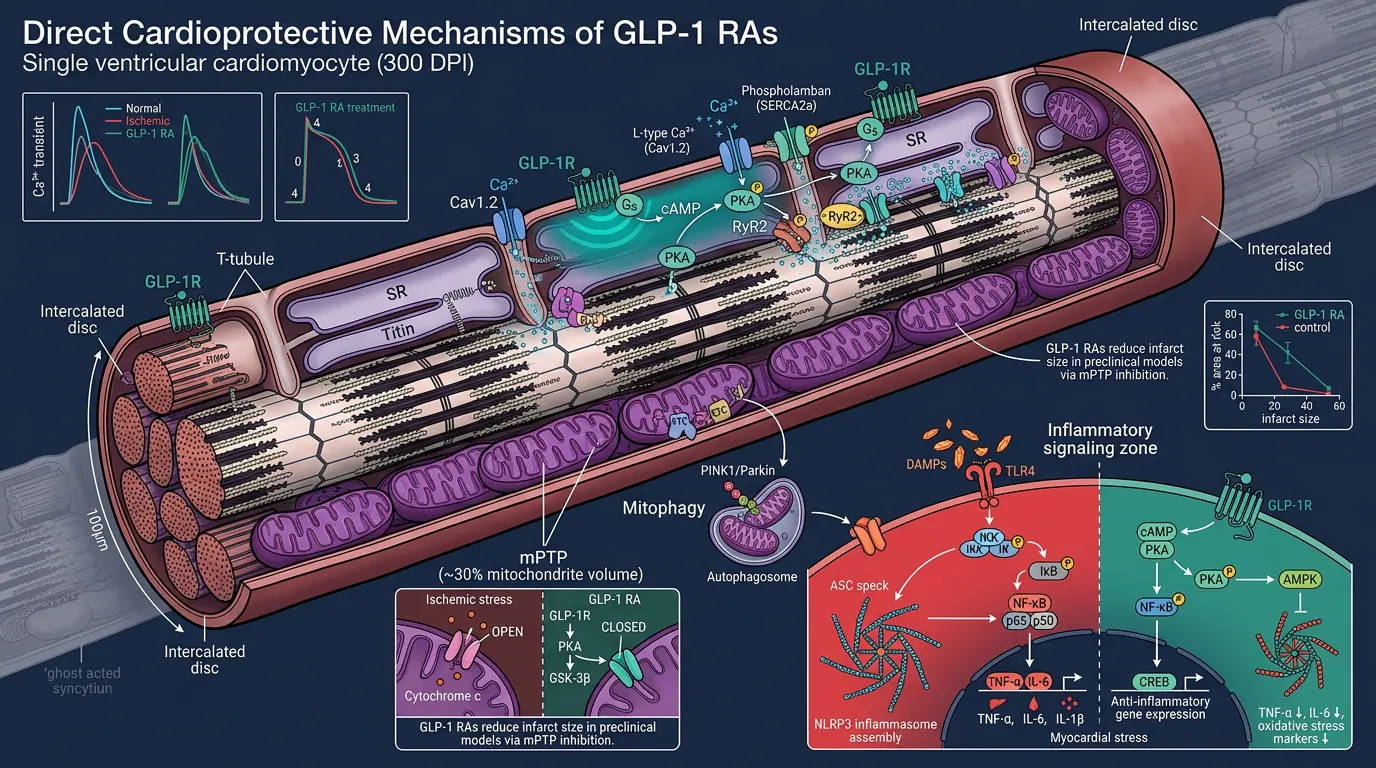
Image description
The illustration presents Compartmentalised signal termination by phosphodiesterases.
Clinical interpretation
PDE isoforms create spatial gradients of cAMP, preventing uncontrolled insulin release. PDE inhibitors (e.g. in heart failure) may theoretically interact with GLP-1 cAMP signalling — clinical significance is usually minor.
Cellular signalling network IV
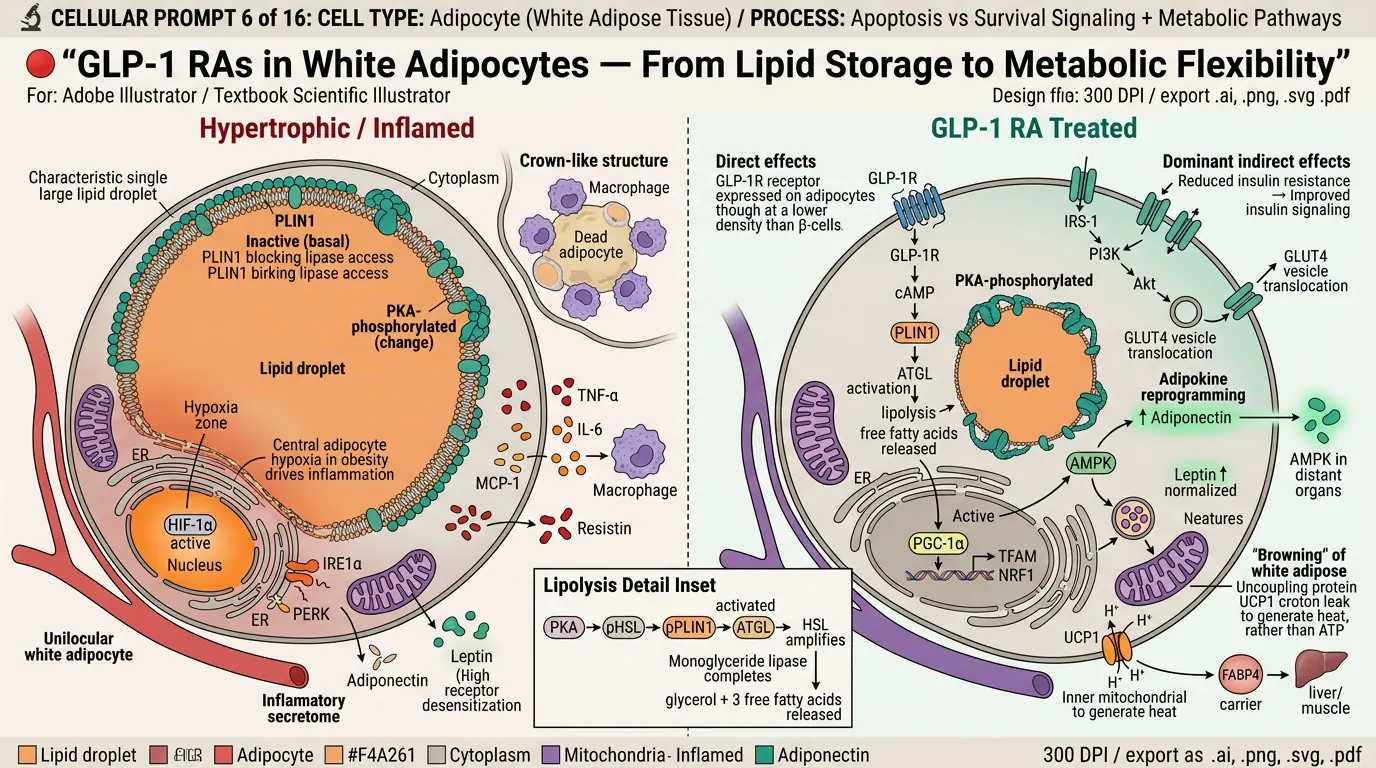
Image description
The illustration presents Downstream effectors of incretin potentiation.
Clinical interpretation
The amplifying effect of GLP-1 on glucose-stimulated insulin secretion is the primary acute pharmacodynamic endpoint measured in clamp studies and underpins HbA1c reduction in T2DM trials.
Pancreatic islet effects
β-cell ultrastructure and insulin exocytosis under GLP-1R activation
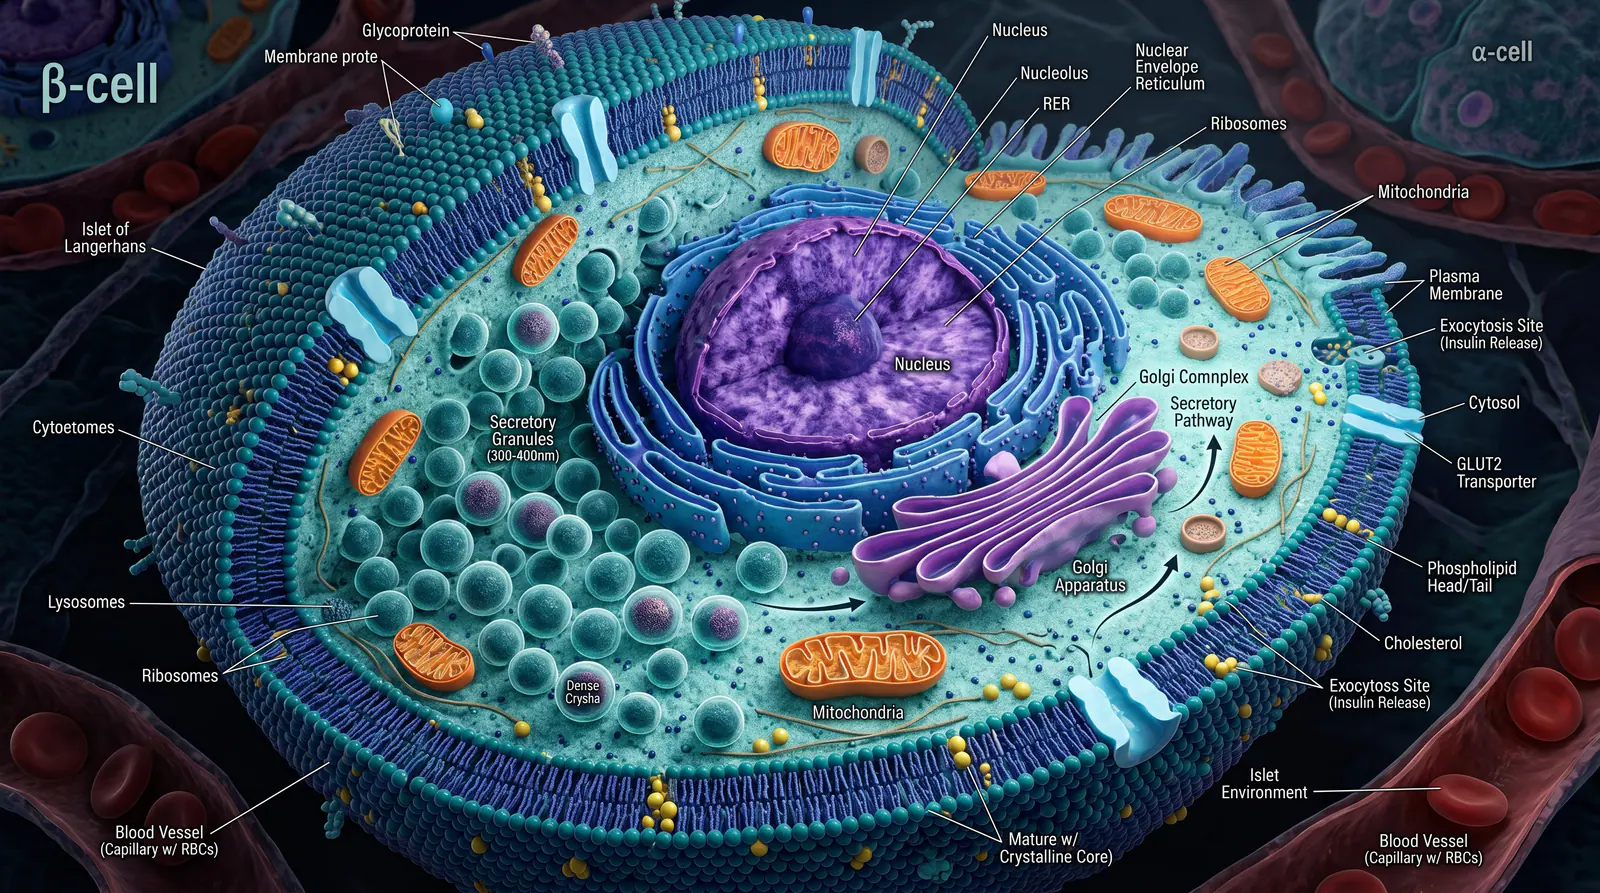
Image description
The illustration presents Organelle architecture supporting glucose-stimulated, GLP-1–amplified insulin secretion.
Clinical interpretation
The β-cell integrates glucose via GLUT2 (rodents) / GLUT1–3 (humans), generating ATP that closes KATP channels and depolarises the membrane. GLP-1R activation amplifies this by increasing cAMP, promoting granule mobilisation from the reserve pool to the readily releasable pool at the plasma membrane. Mitochondria provide ATP for exocytosis; the Golgi processes proinsulin; glucagon from neighbouring α-cells is suppressed in a glucose-dependent manner via paracrine GLP-1 and direct α-cell GLP-1R signalling.
Pancreatic β-cell in metabolic context
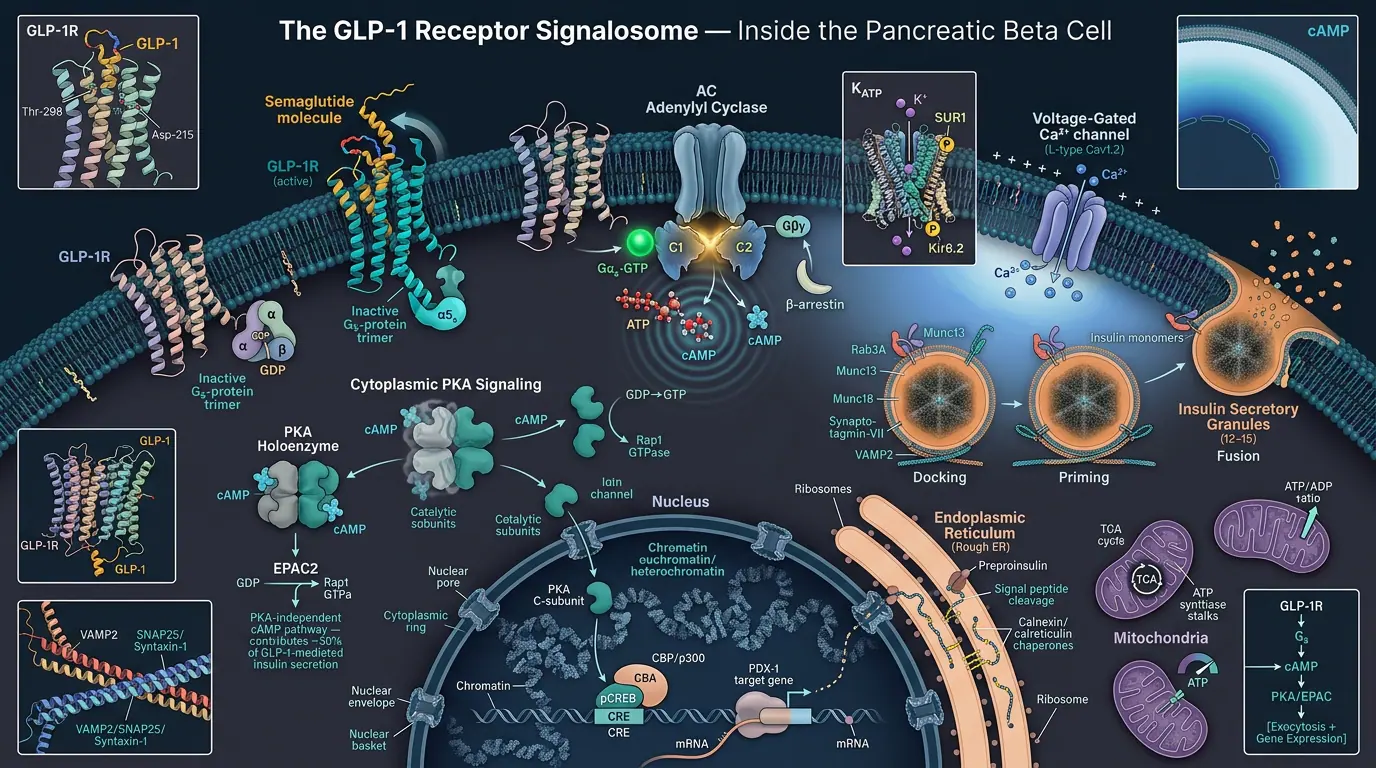
Image description
The illustration presents Central role in glucose sensing and incretin amplification.
Clinical interpretation
β-cells are the primary target for GLP-1R-mediated glycaemic lowering. In T2DM, incretin effect is blunted (~30% of normal) due to reduced secretion and some resistance; pharmacological GLP-1R activation partially restores postprandial insulin secretion without abolishing glucose dependence.
Islet of Langerhans architecture
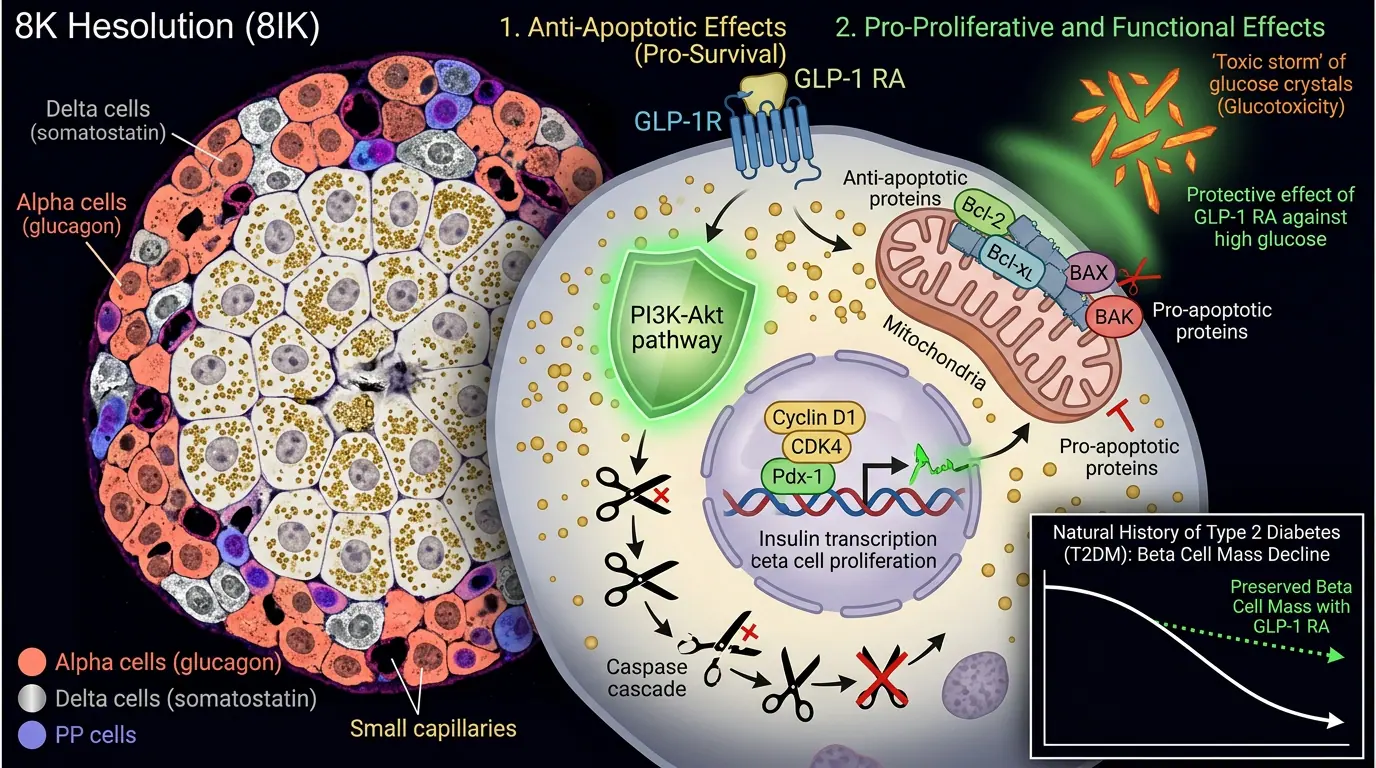
Image description
The illustration presents Paracrine cross-talk between α, β, δ, and PP cells coordinates hormone output.
Clinical interpretation
Islet architecture places β-cells centrally with α-cells at the periphery, enabling paracrine glucagon suppression when β-cells release insulin and when GLP-1 acts on α-cell GLP-1R. GLP-1 also inhibits somatostatin from δ-cells, indirectly amplifying insulin and glucagon effects.
GLP-1 signalling in the β-cell
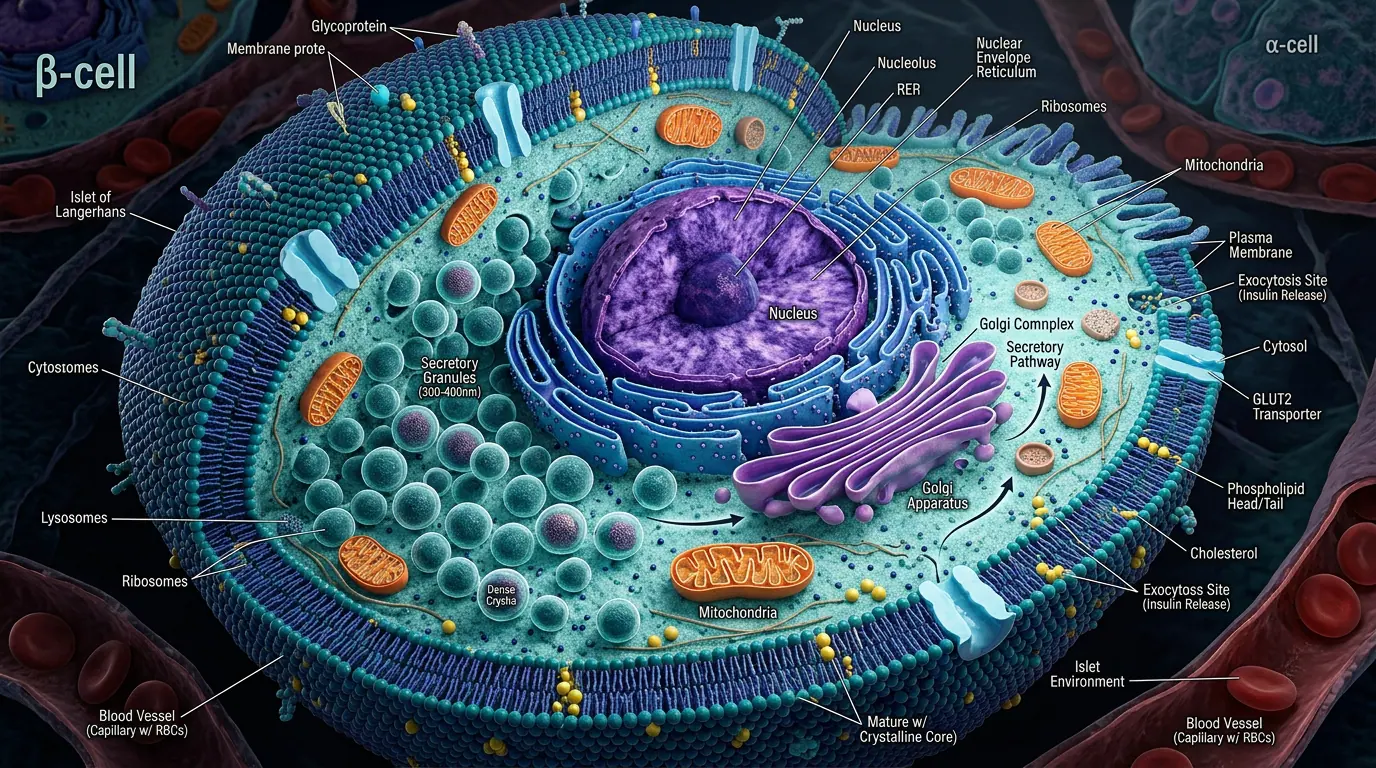
Image description
The illustration presents Convergence of glucose and incretin pathways on exocytosis machinery.
Clinical interpretation
Glucose provides the triggering signal (ATP, KATP closure, Ca²⁺ influx); GLP-1 provides a potentiating signal via cAMP. This dual requirement underpins the low hypoglycaemia risk of GLP-1 RA monotherapy.
Extrapancreatic organ effects
Multi-organ effects of GLP-1 receptor activation
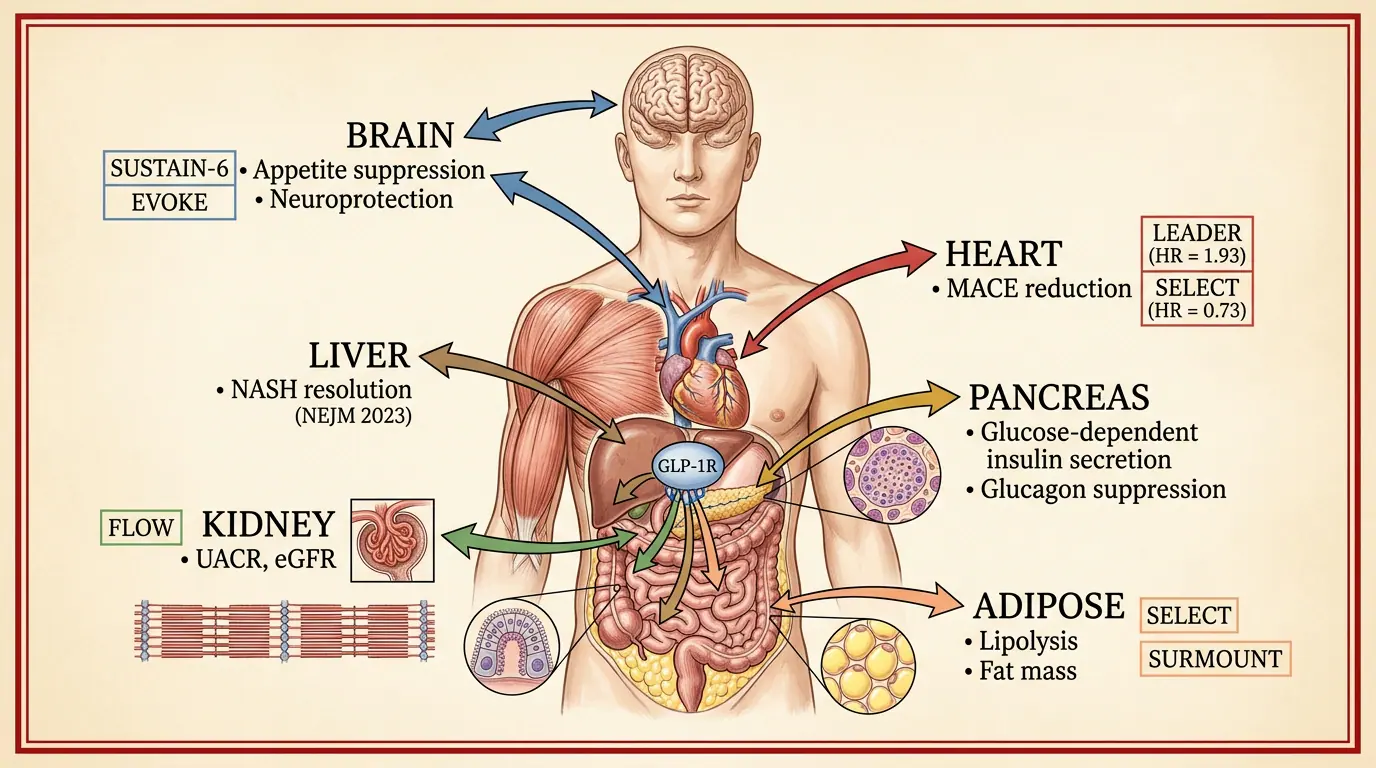
Image description
The illustration presents Systemic actions beyond glycaemia — GI, CNS, cardiovascular, and renal.
Clinical interpretation
GLP-1R activation slows gastric emptying (major contributor to nausea and early satiety), reduces appetite via hypothalamic and brainstem circuits, may improve endothelial function, reduces blood pressure modestly, and in the kidney reduces albuminuria independent of glucose lowering in several trials.
Central appetite regulation — mesolimbic pathways
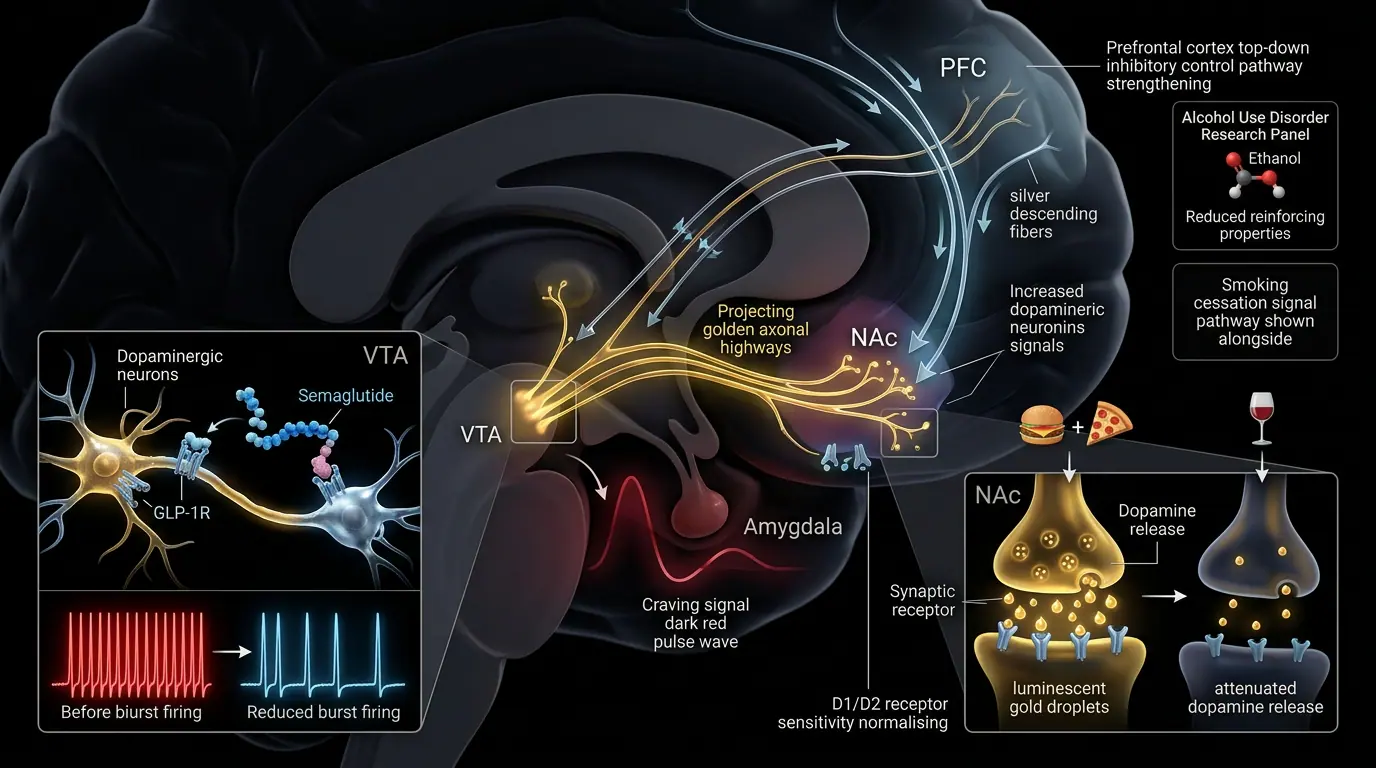
Image description
The illustration presents GLP-1R in hypothalamus and reward circuits reduces food reward and intake.
Clinical interpretation
GLP-1 acts on arcuate nucleus and paraventricular nucleus neurons, and on mesolimbic dopamine pathways to reduce hedonic eating. Nausea may partly reflect central GLP-1R activation. Neuropsychiatric surveillance has increased with high-dose obesity use.
Gut–brain axis and microbiome interactions
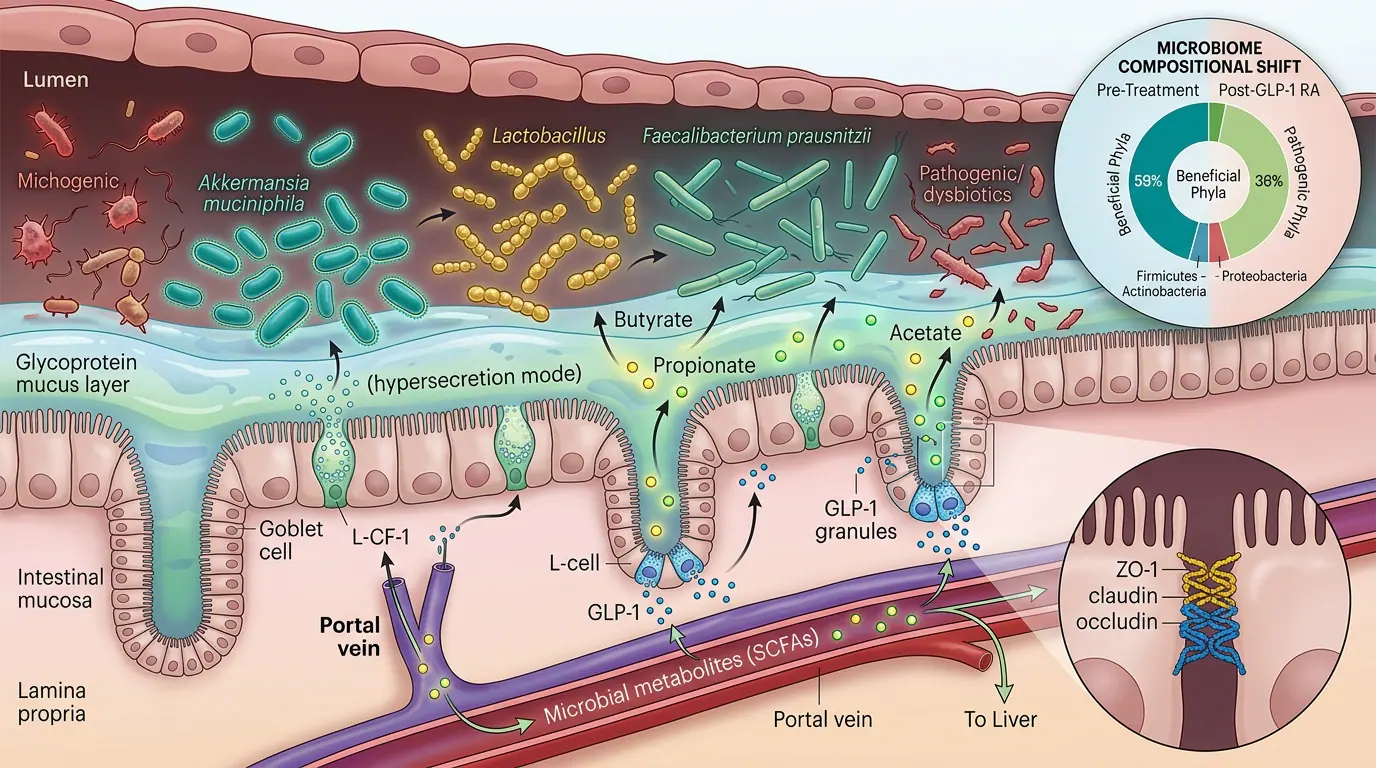
Image description
The illustration presents Emerging links between gut ecology, L-cell function, and GLP-1 secretion.
Clinical interpretation
Short-chain fatty acids from fibre fermentation may stimulate L-cell GLP-1 secretion via FFAR2/3. Bariatric surgery dramatically raises GLP-1 — partly anatomical, partly microbiome-mediated. GLP-1 RAs do not directly target microbiome but outcomes may interact with diet composition.
Dual & triple receptor agonism
Receptor triptych — GLP-1R, GIPR, and GcgR
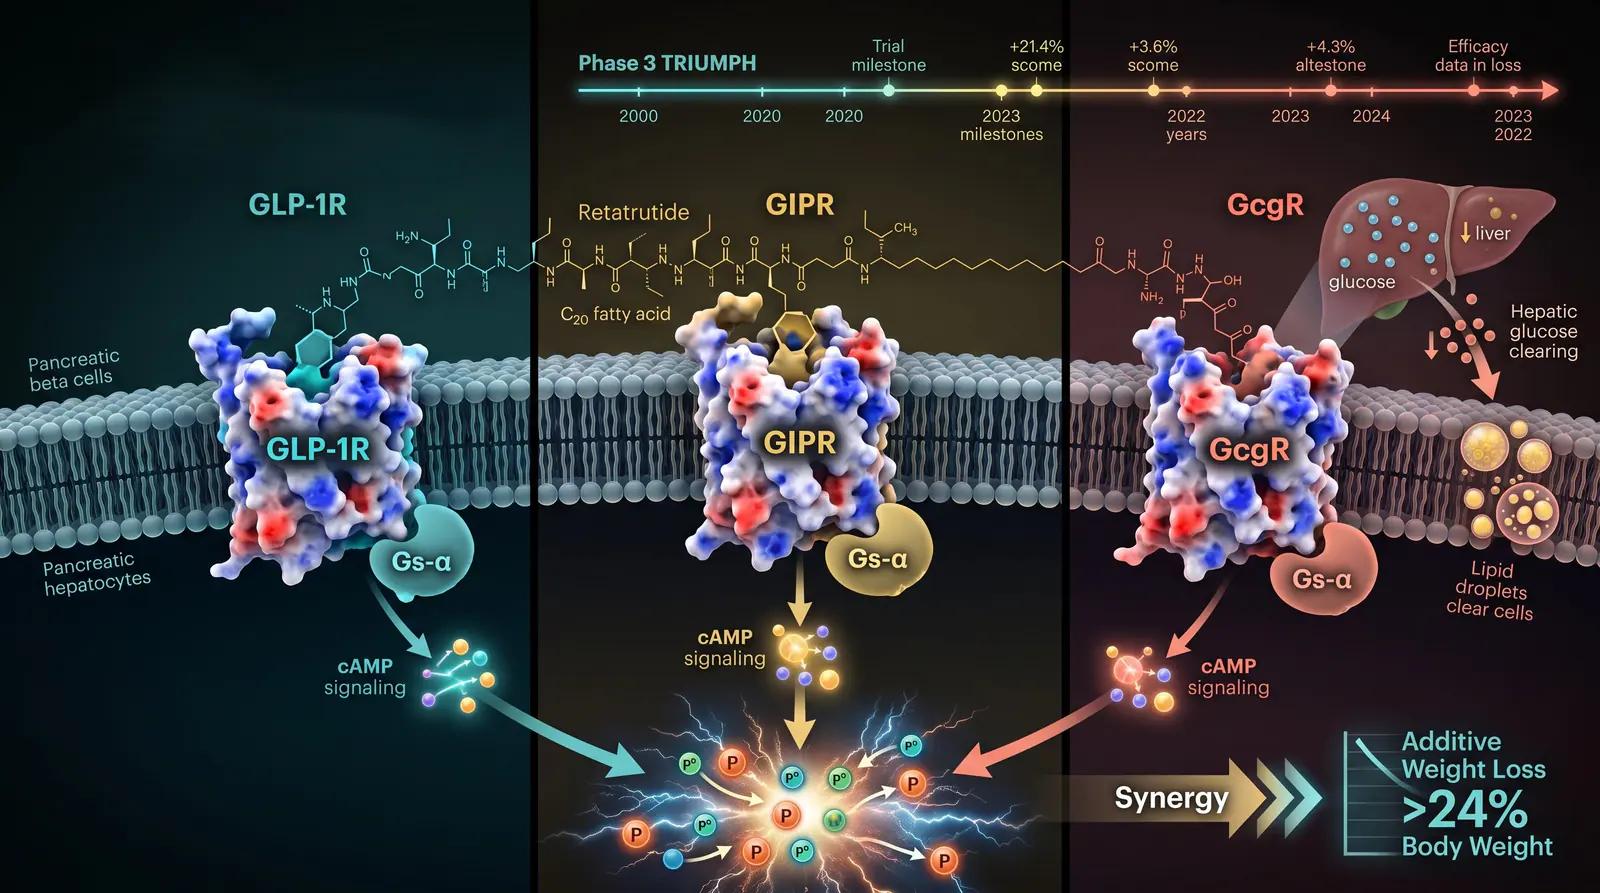
Image description
The illustration presents The expanding target landscape from selective GLP-1R agonism to multi-incretin and triple agonists.
Clinical interpretation
Licensed GLP-1 RAs target the GLP-1 receptor (Class B GPCR). Tirzepatide adds GIP receptor agonism, producing supra-additive weight loss and glycaemic effects versus selective GLP-1R agonism alone. Retatrutide (Phase 3) adds glucagon receptor agonism at low dose, increasing energy expenditure while GLP-1R/GIPR components maintain glycaemic control and appetite suppression. Understanding receptor distribution and bias informs drug selection and anticipated side-effect profiles.
Tirzepatide dual GIP/GLP-1 agonism
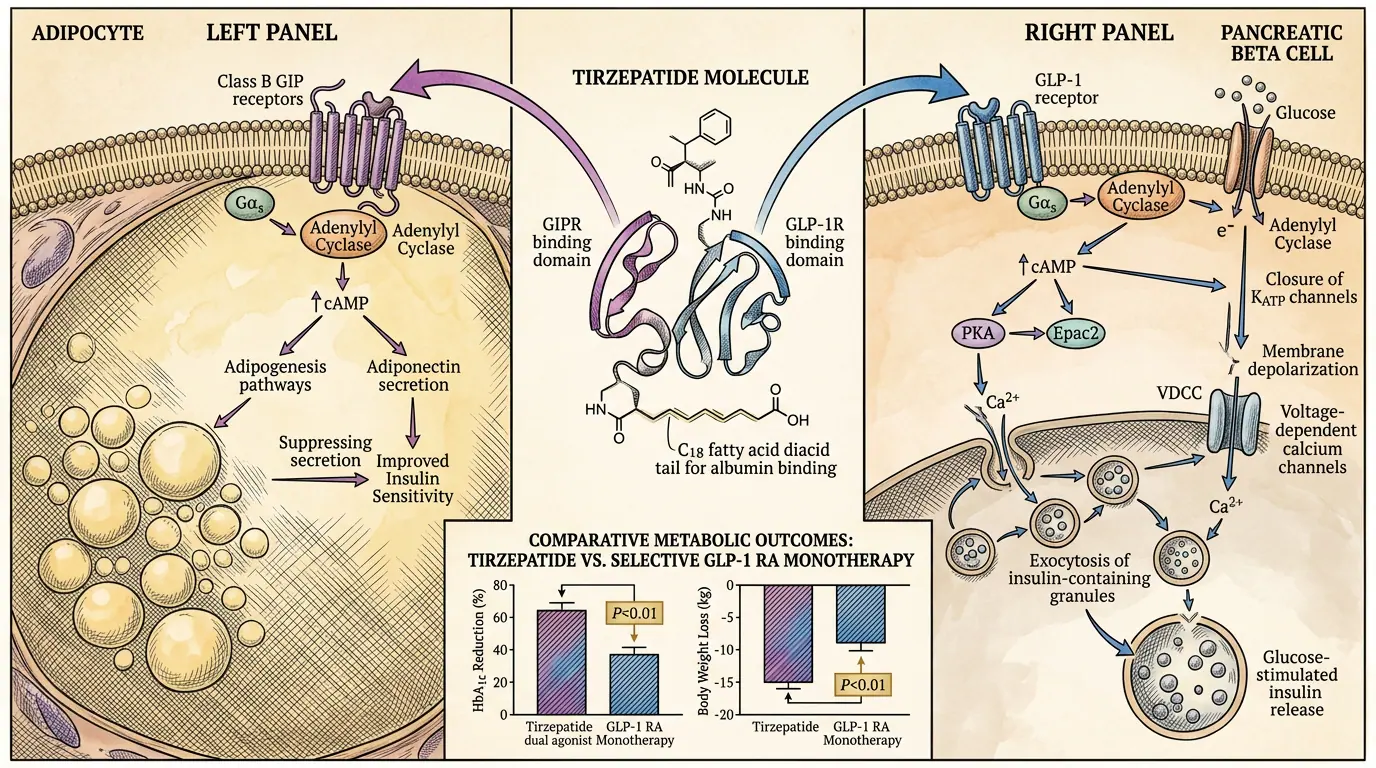
Image description
The illustration presents Co-agonism at GIPR and GLP-1R drives superior weight and HbA1c outcomes in SURPASS/SURMOUNT.
Clinical interpretation
Tirzepatide is a 39-amino acid peptide with agonist activity at both GIP and GLP-1 receptors. SURPASS trials demonstrated HbA1c reductions up to 2.4% and SURMOUNT weight loss up to ~22% at highest doses. GI tolerability profile is similar though not identical to selective GLP-1 RAs.
Molecular landscape of incretin multi-agonists
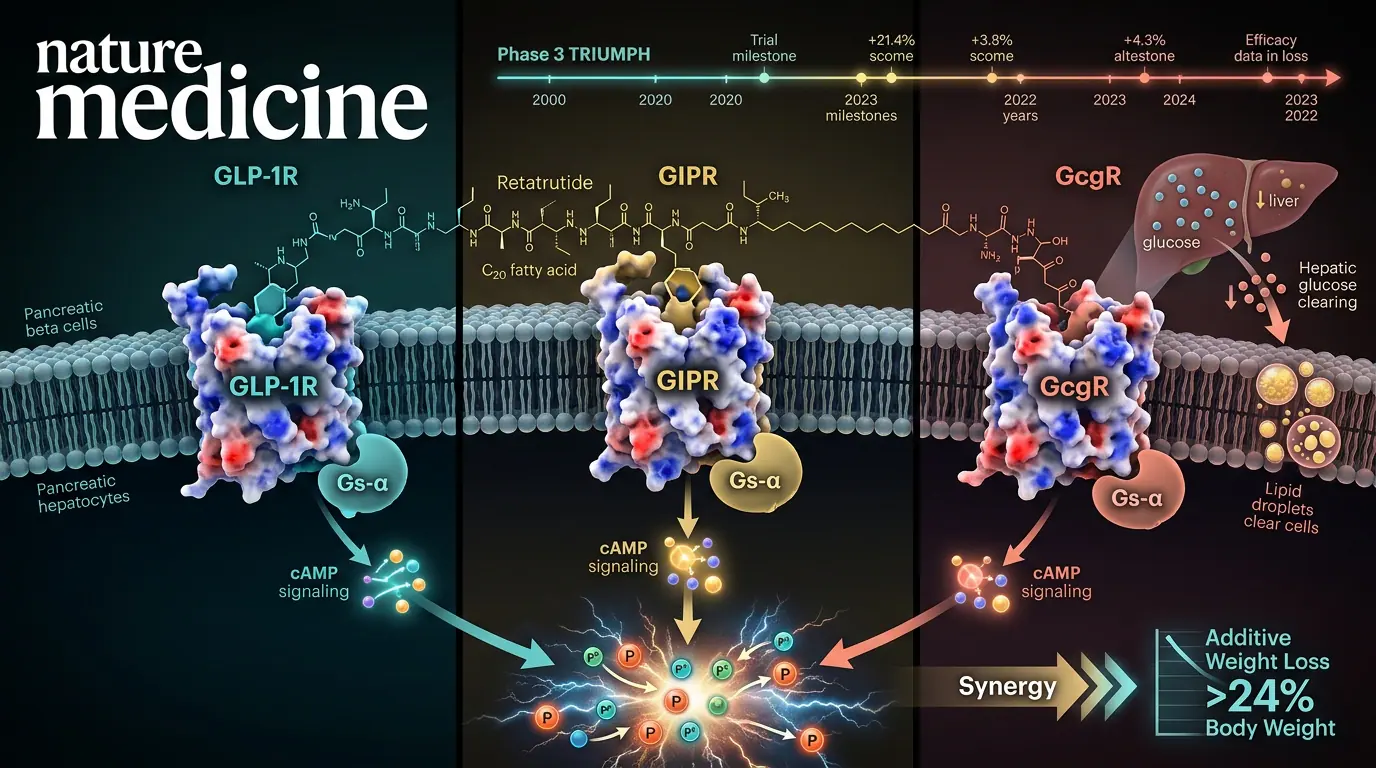
Image description
The illustration presents Structural basis for dual and triple receptor engagement.
Clinical interpretation
Engineered peptides balance potency at GLP-1R, GIPR, and optionally GcgR. Receptor selectivity and bias determine metabolic phenotype — e.g. hepatic fat reduction with glucagon component, appetite suppression with GLP-1 component.
Drug-specific pharmacology
GLP-1 RA pharmacodynamics overview
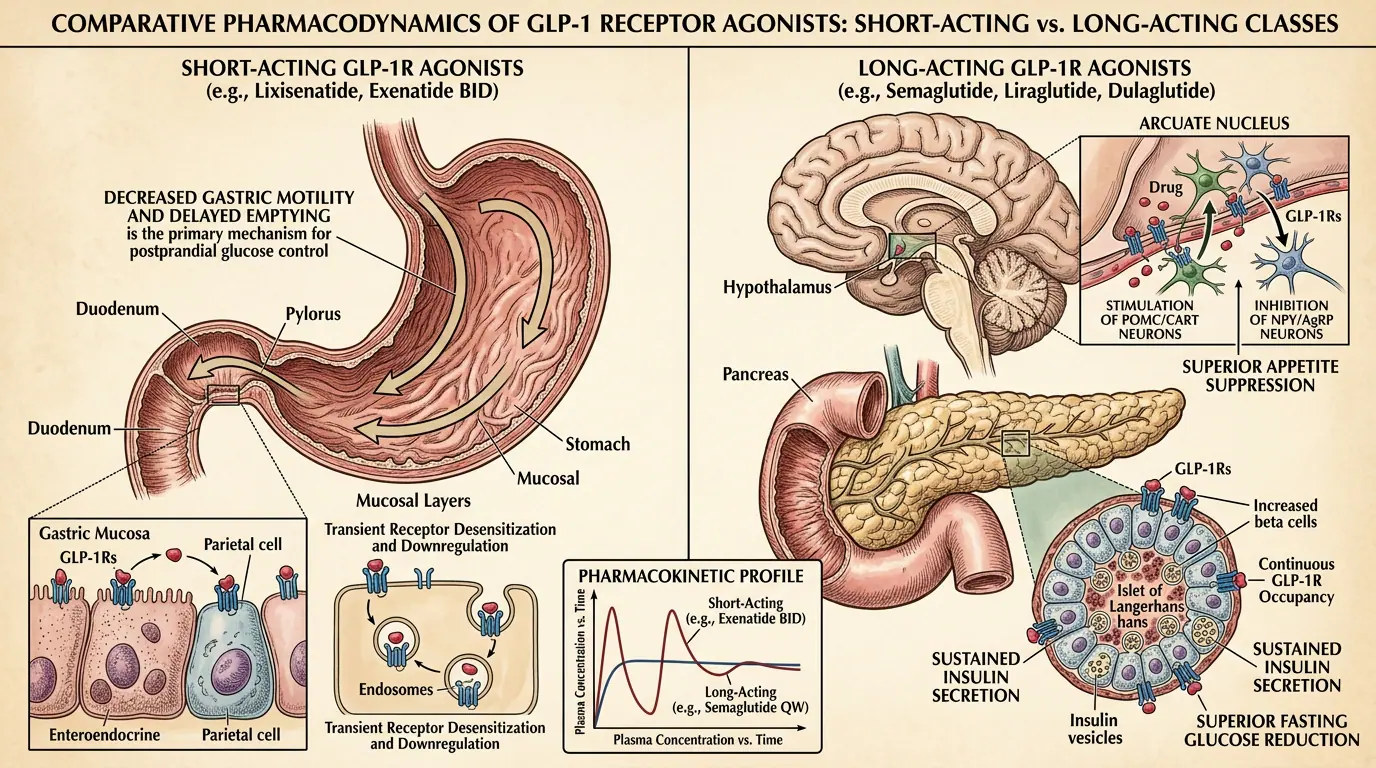
Image description
The illustration presents Dose–response relationships for glycaemic, weight, and GI effects.
Clinical interpretation
Therapeutic GLP-1 RAs achieve supraphysiological receptor occupancy with flattened PK profiles versus native peptide. GI side effects often plateau while weight and glycaemic benefits continue titrating upward, informing slow dose-escalation protocols.
Rapid signalling dynamics
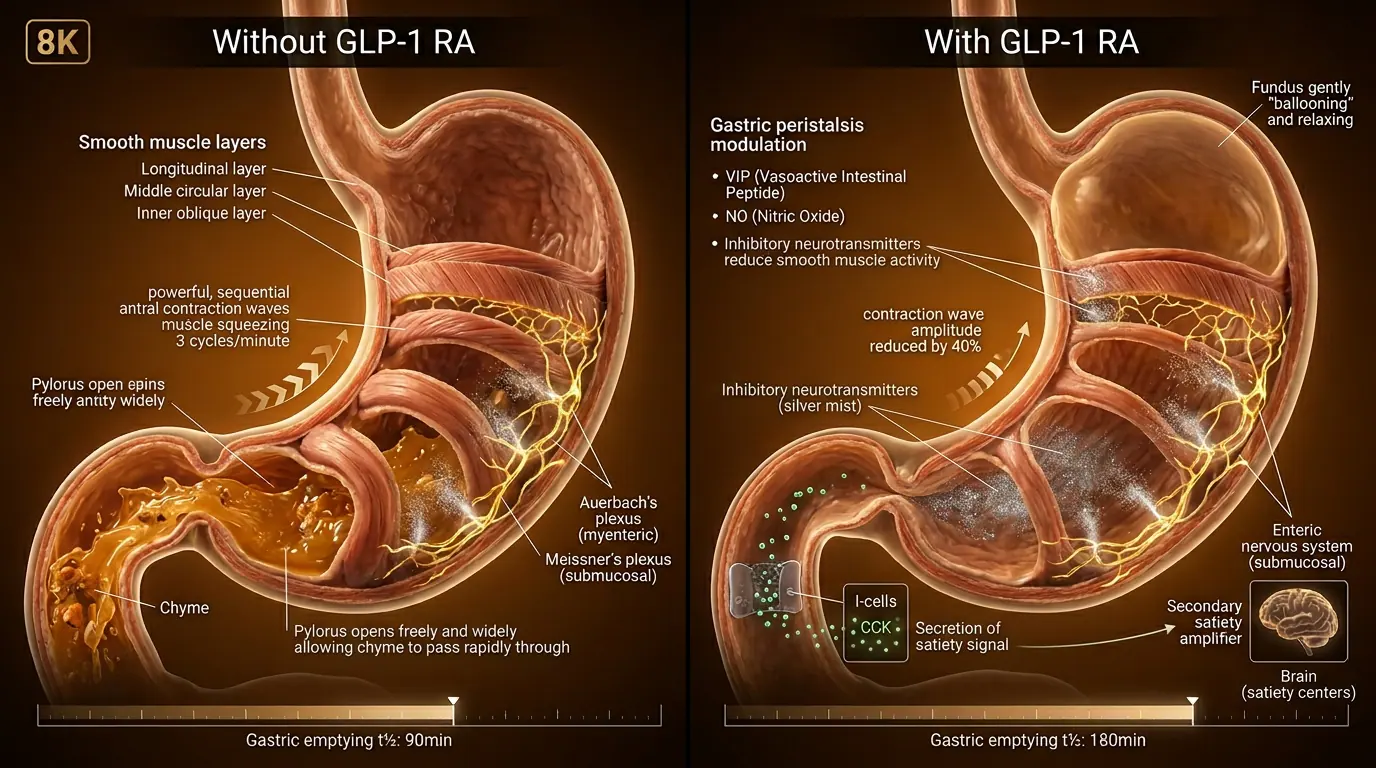
Image description
The illustration presents Acute versus chronic GLP-1R-mediated adaptations.
Clinical interpretation
Acute effects (insulin secretion, gastric emptying) occur within minutes to hours; chronic effects (weight loss, HbA1c, CV remodeling) evolve over weeks to months and may involve distinct receptor populations or neural adaptation.
Clinical FAQs
Frequently asked questions
How do GLP-1 receptor agonists work?
GLP-1 receptor agonists mimic the incretin hormone glucagon-like peptide-1. They bind GLP-1 receptors to stimulate glucose-dependent insulin secretion, suppress glucagon release, slow gastric emptying and act on hypothalamic centres to reduce appetite. The combined effect lowers blood glucose and body weight.
Why do GLP-1 agonists cause weight loss?
Weight loss occurs mainly through central appetite suppression and delayed gastric emptying, which increase satiety and reduce energy intake. The glucose-dependent mechanism means the effect persists without causing hypoglycaemia in most patients.
What is the difference between a GLP-1 agonist and a dual GIP/GLP-1 agonist?
A GLP-1 agonist activates only the GLP-1 receptor. A dual agonist such as tirzepatide also activates the GIP receptor, producing greater reductions in HbA1c and body weight in trials.